Distributing data is hard
Distributed systems are hard because they introduce the tradeoff of increased deployment complexity in exchange for linear horizontal scalability. With resource exhaustion from the physical servers, a “just add more nodes” attitude generally gets you out of trouble. If we were to talk of a stateless system that only focuses on compute, we would only have to monitor resource usage — scale accordingly and call it a day.
However, Apache Pinot is not a stateless platform. It is a distributed OLAP database. On top of our physical resource monitoring requirements, we also need to be aware of how data is distributed and how usage patterns affect the overall user experience.
Scaling a distributed system
I may be kicking open doors here, but a simple question has always helped me start from somewhere. When it comes to investigating degraded user experience caused by latency, can I observe high resource usage on all or some nodes of the system?
A negative answer to that question is the worst since it is an indicator that you might be facing a software bug or slow external dependency from your system that you are not monitoring. How quickly you can identify the root cause will greatly depend upon how well you are equipped to monitor your external dependencies.
This post will explore how you can easily set up a monitoring stack for Apache Pinot, that will help you troubleshoot occurrences where your system is under-provisioned or where data is not evenly distributed. The investigation will generally begin with:
Is resource usage high on all nodes (both system and JVM) or is it only a few nodes?
When all your servers are running hot and the system operates in the expected throughput for a given scale, the answer becomes “just throw more nodes at it”. If that is not the case, it usually means that it is time to roll up the sleeves, dig in and investigate what usage patterns cause some specific nodes of the system to go under high utilization.
Preparing an observability stack for Apache Pinot
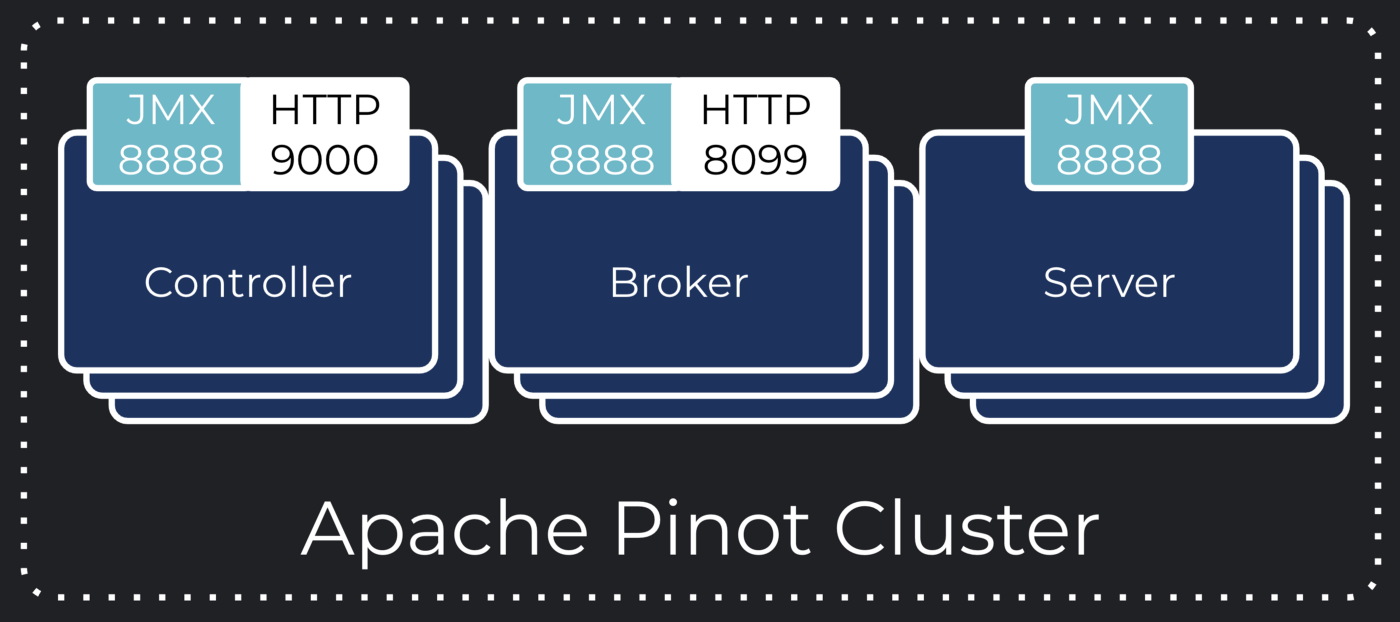
Going through such a decision tree, highlights that we need system resource level metrics as well data-level metrics from Apache Pinot. Without both of them, you will only be making wild guesses about what is wrong with the system. There are loads of solutions and technologies out there that will help you out with system resource metrics. As for data-level metrics, there’s no dark magic here. Any metrics that can be contextualized to specific data sets need to be emitted by the originating system that you are monitoring. Conveniently, Apache Pinot generates an extensive set of data metrics all exposed through JMX. If your metric system can consume JMX, you should be able to integrate without hurdles.
Making life easier with Prometheus
The Apache Pinot team packaged out-of-the-box support for Prometheus, the ubiquitous cloud-native metric monitoring toolkit. While not forcing you into a specific monitoring infrastructure, you can opt-in options to activate the Prometheus JMX exporter that is packaged within the Apache Pinot Docker image. The image also comes with a pre-configured exporter configuration.
Just add these JVM arguments to the JAVA_OPTS environment variables of your Apache Pinot containers and Prometheus will be able to scrape your instances:
-javaagent:jmx_prometheus_javaagent-0.12.0.jar=8888:exporter-config.yml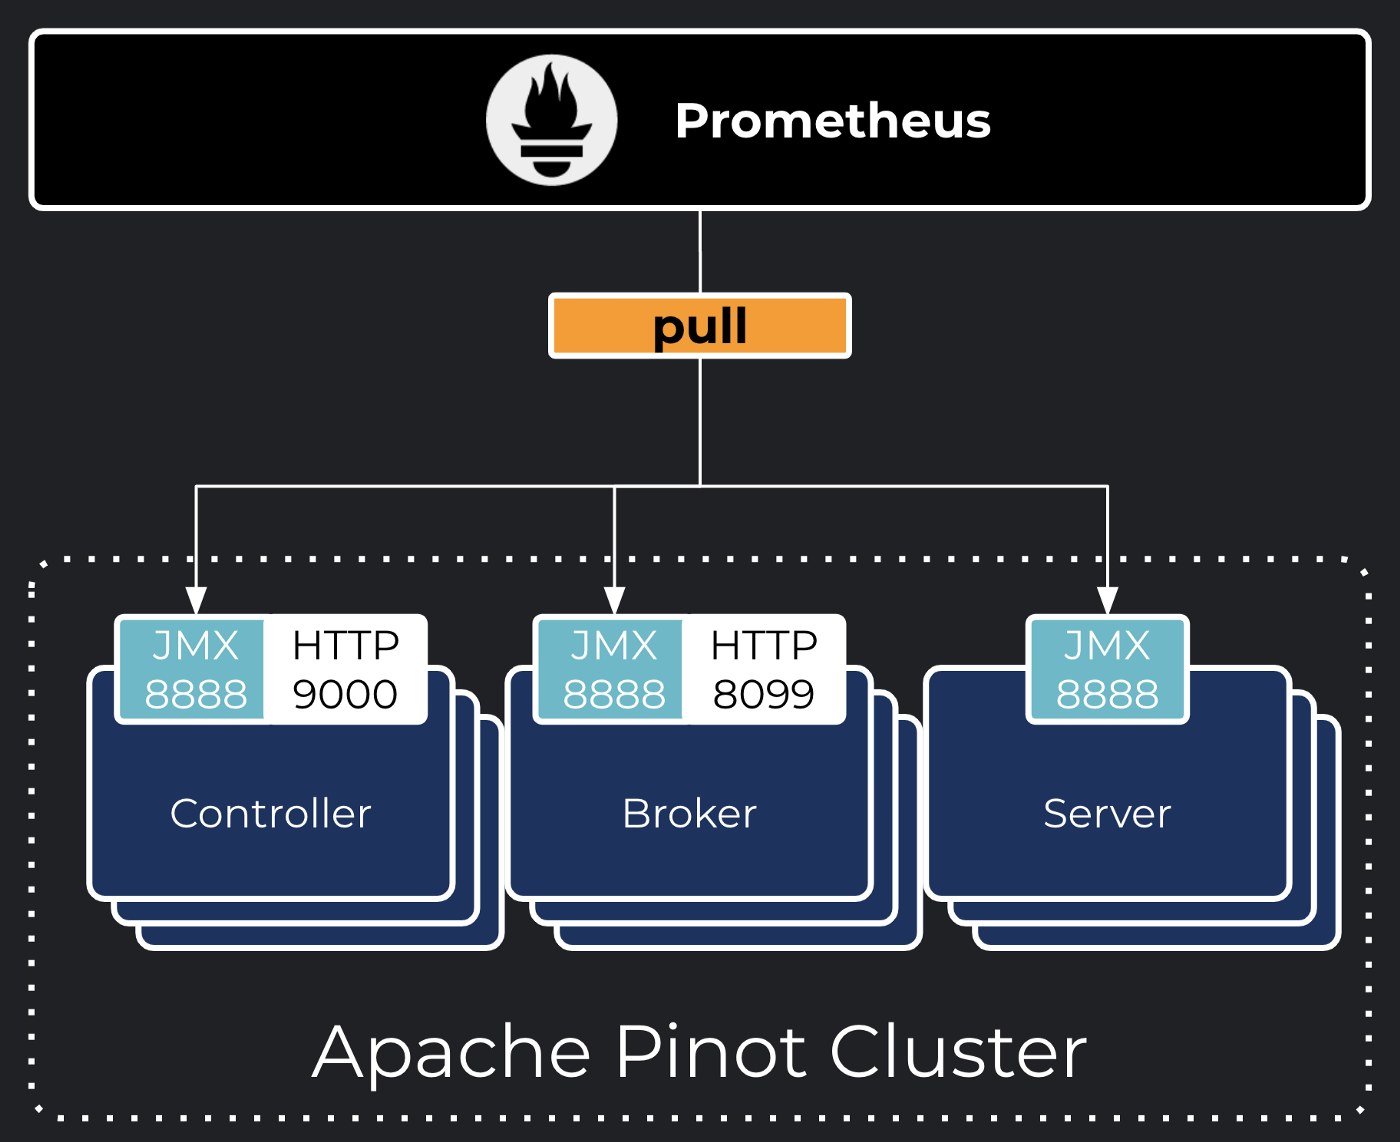
Not using Docker?
No problem, just bring your own Prometheus JMX Exporter and your jmx exporter config. Just ensure you adapt your JAVA_OPTS environment variable with the correct paths for these two files.
Let’s prepare a demo environment
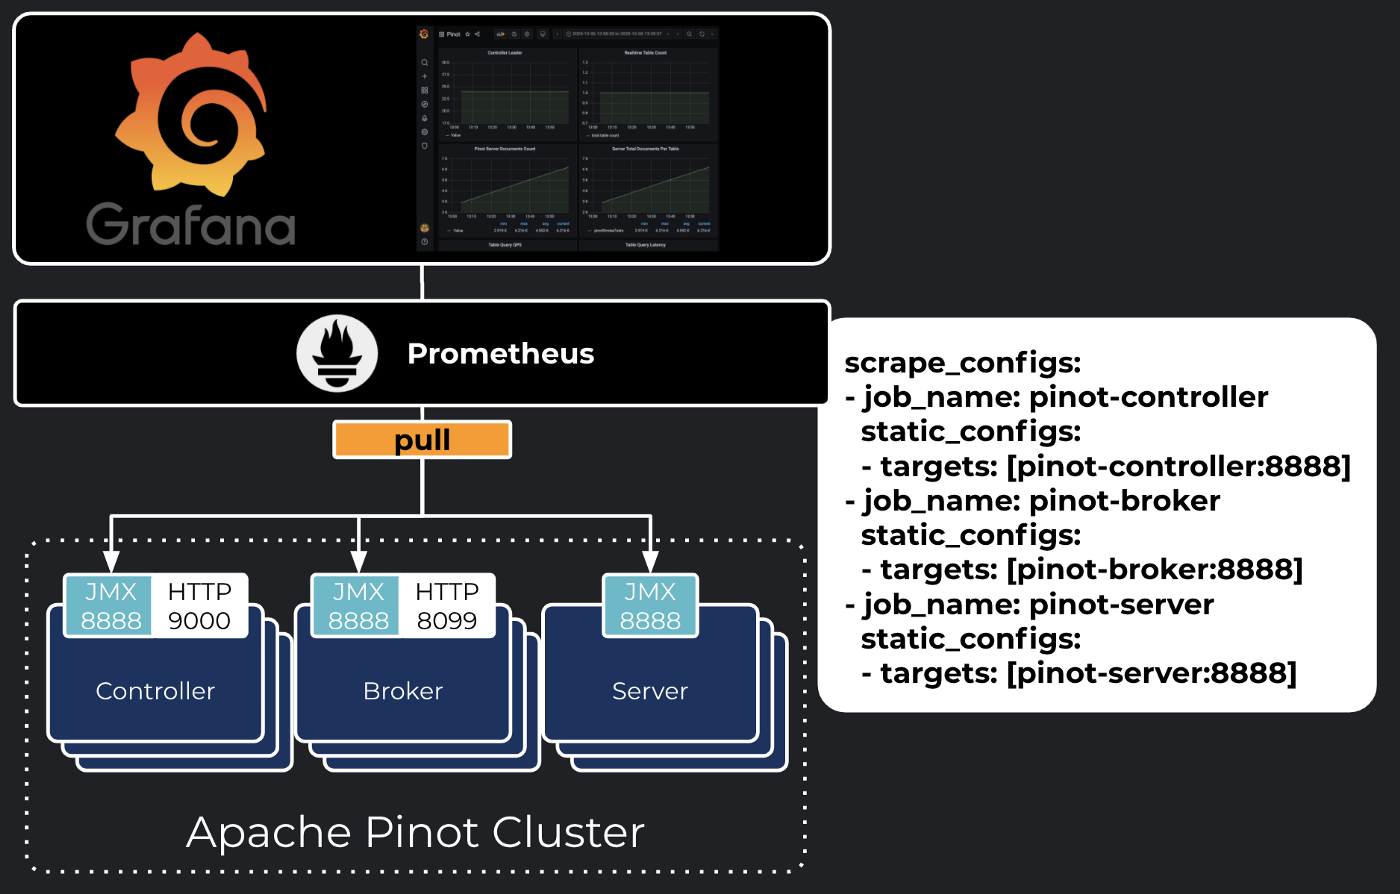
To demonstrate the Apache Pinot integration with Prometheus, I have prepared a sample repository containing a docker-compose deployment pre-configured with Pinot, Prometheus, Grafana, and a simple Smoke Test application that emits events into Pinot through Kafka. Prometheus supports more than a dozen of discovery mechanisms such as Consul and Kubernetes. For the sake of simplicity, the example that follows will showcase static configurations referring to our Pinot components manually configured in a prometheus.yml file. Look out for the Apache Pinot reference documentation for a tutorial about Metric discovery on Kubernetes.
Prerequisites
- git
- docker
- docker-compose
- Java 8 or more recent
Download the source code
$ git clone https://github.com/daniellavoie/monitoring-apache-pinotCode language: PHP (php)Taking a look at the deployment manifest
The docker-compose manifest’s notable configurations are the JAVA_OPTS environment variable for all pinot components and the volume mount to the Prometheus scrape configuration.
Start the demo environment
$ cd monitoring-apache-pinot && git checkout blog && ./run.shAccess the Pinot Dashboard
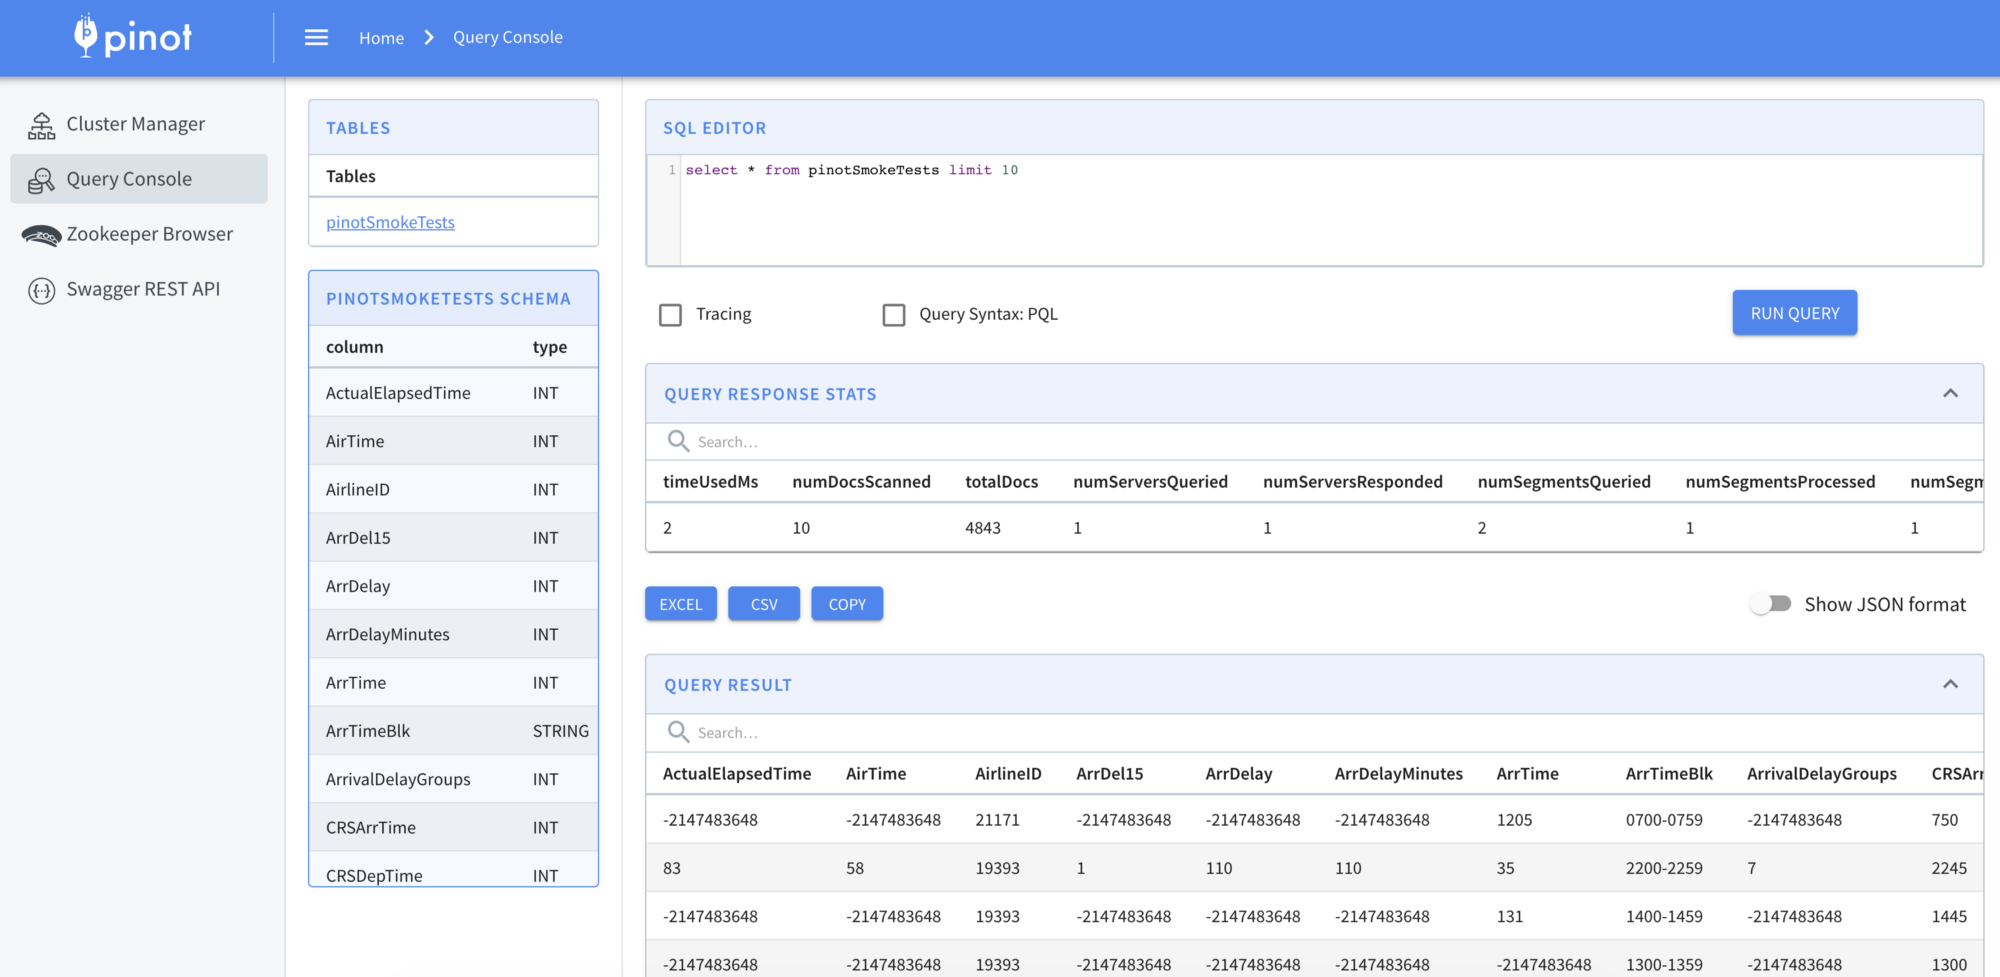
Open your browser and navigate to http://localhost:9000/. You will be able to review the Pinot cluster status. Wait until you can acknowledge that the broker, controller, and server have the Alive status.

The Query Console (http://localhost:9000/#/query) will also help you confirm that some data is effectively being written to Pinot through the embedded Smoke Test application and Kafka.
Accessing the Grafana Dashboard
The last piece of this puzzle is Grafana, one of the defacto monitoring dashboards for cloud-native software. Our Prometheus instance will be configured as a datasource within Grafana and allow us to build graphs metric displays.
pinot-smoke-tests.png
The sample project is conveniently packaged with auto-configured Prometheus Datasource and Grafana dashboard for Pinot. Using the admin / password credentials, access this dashboard through https://startree.ai/d/a2HnNdCWk/pinot?orgId=1&refresh=5m.
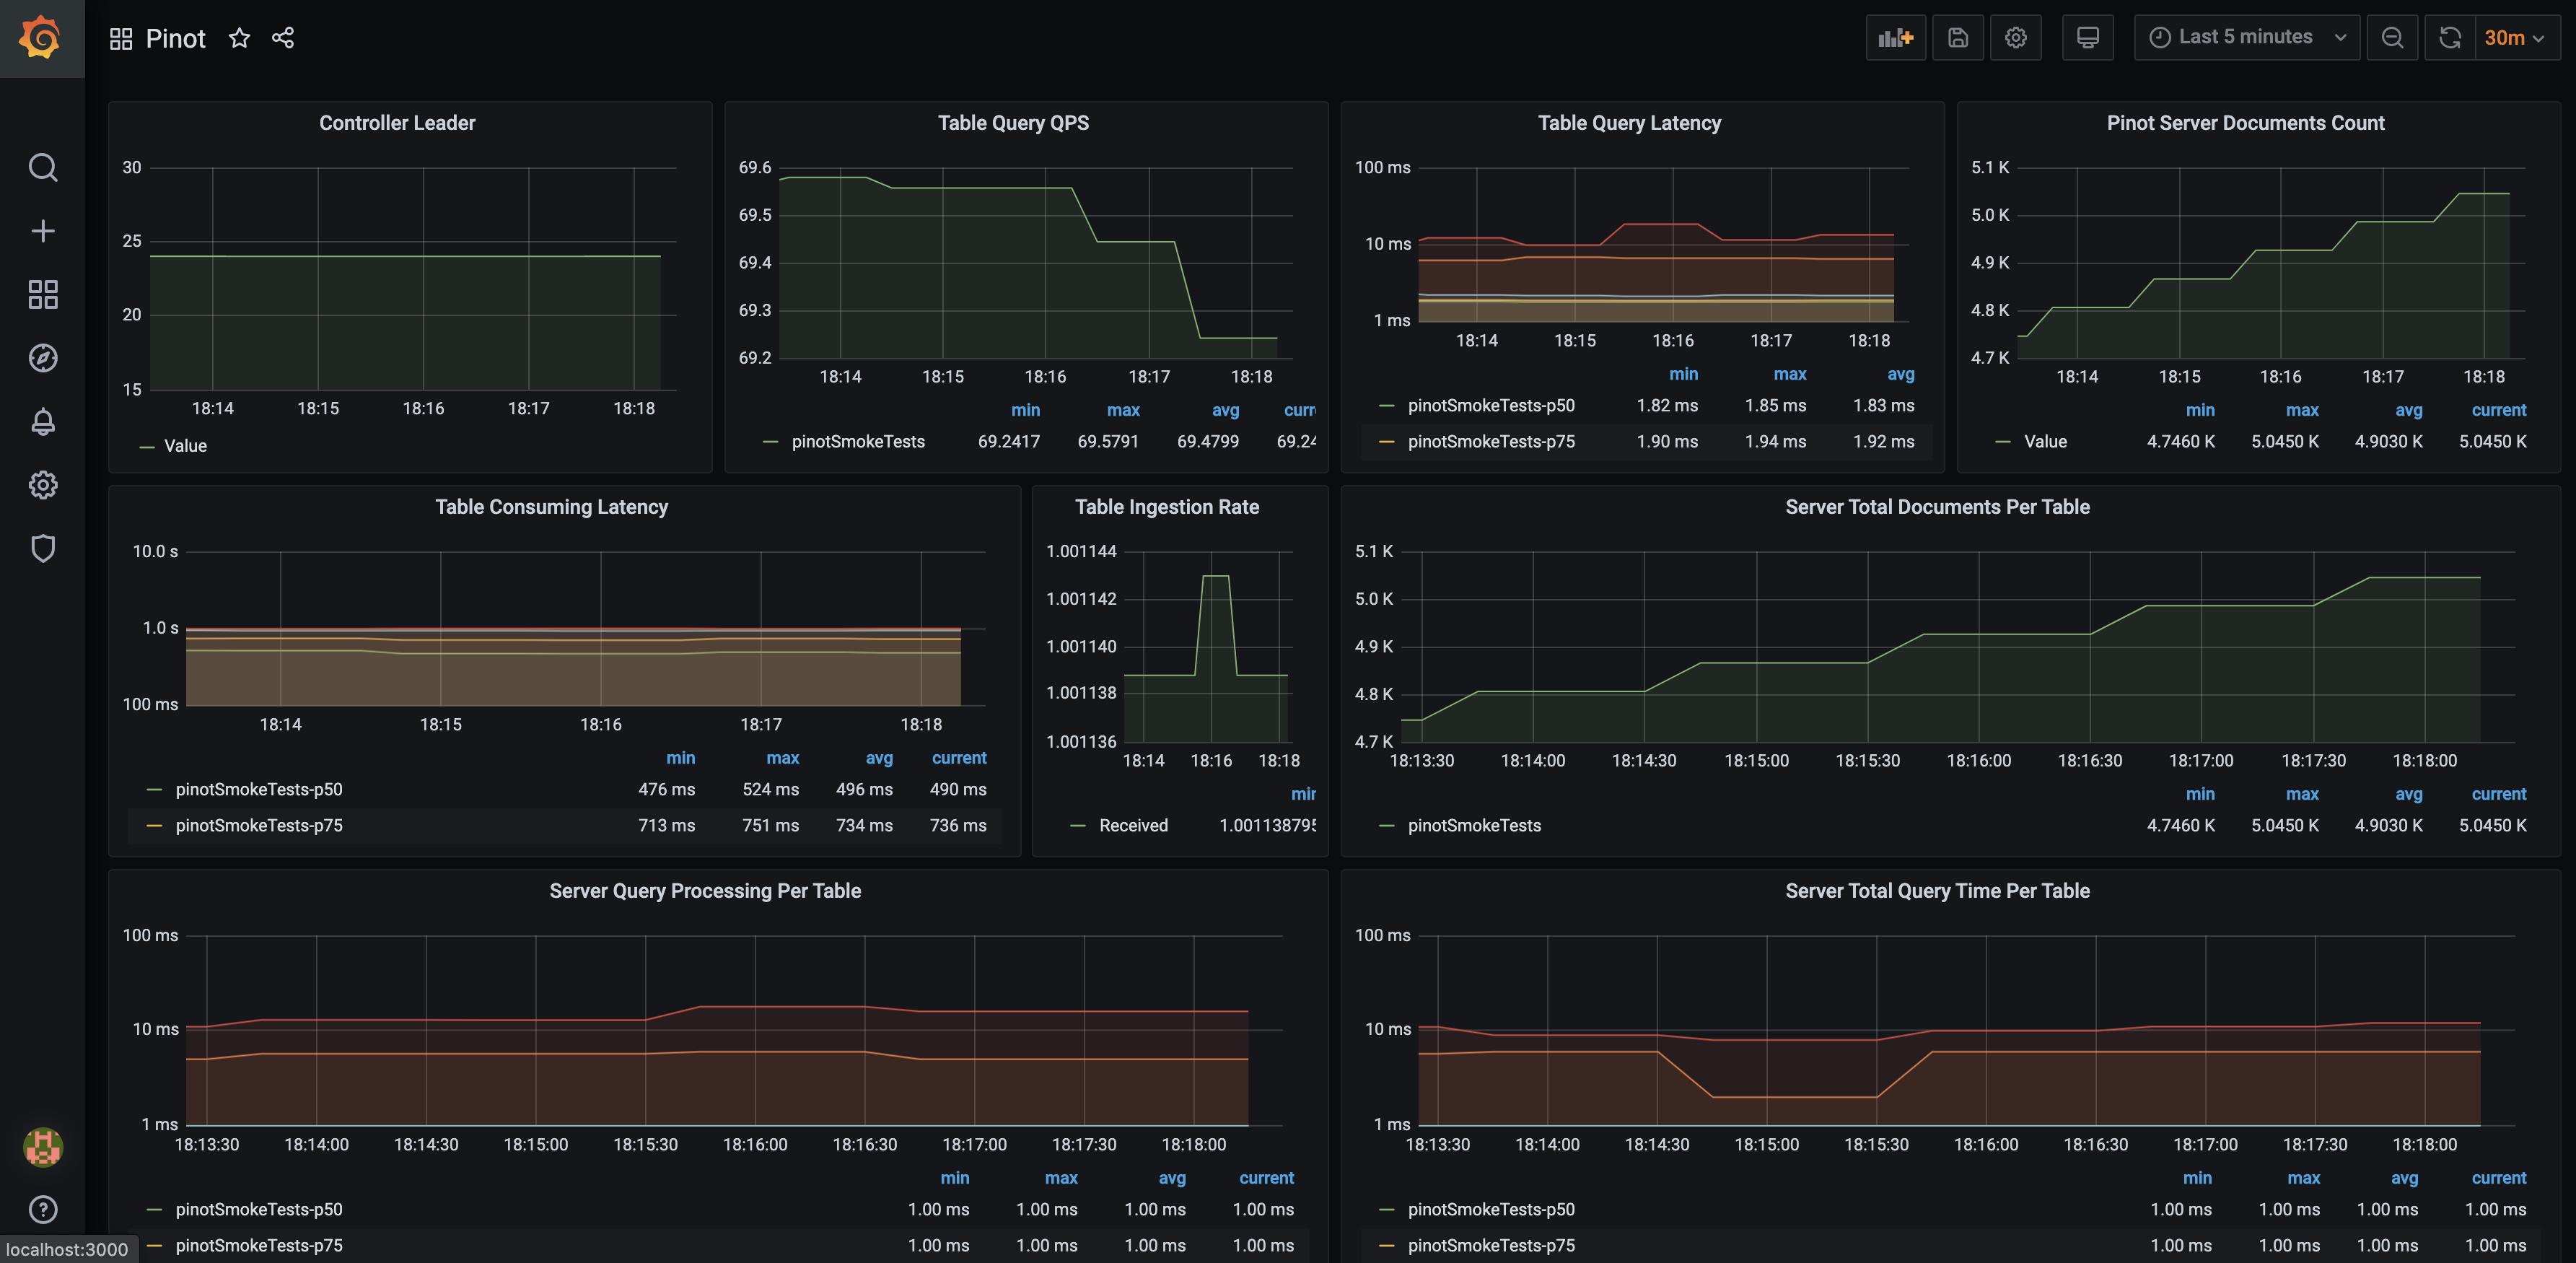
Alright, what am I looking at now?
One interesting thing about the metrics being emitted by Apache Pinot is that they are mostly relatives to your tables. Create a new table, and Grafana will dynamically start displaying a data series for the tables, as they are automatically discovered by Prometheus through the JMX Exporter. While this sample dashboard may not be complete, it is a fine canvas to customize to your own needs and highlight sensitive metrics related to the usage pattern you are making out of Apache Pinot.
Showcasing some metrics
Table Query Latency
Probably the most obvious metric to keep an eye on, the Table Query Latency provides a direct answer on the overall reactivity of the system. How fast a query executes is always relative to expectations, infrastructure sizing as well as the dataset scope. Any table that goes beyond a threshold deemed reasonable should trigger an investigation from an SRE.
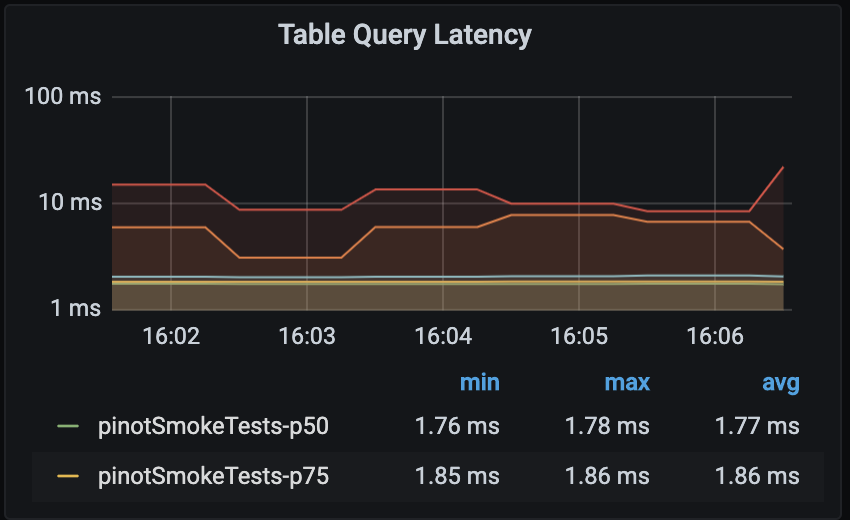
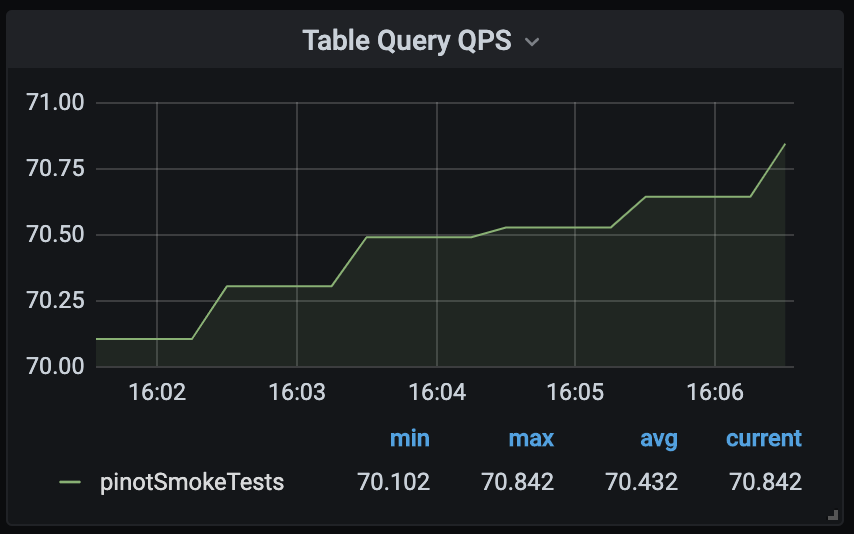
Table Query QPS
This metric will indicate how many queries are processed by Pinot per table. If a spike in latency is observed, this metric will certainly help immediately identify if the cluster is suddenly facing more requests than usual.
What is coming up next?
In my next post, we will explore more of the available metrics, as well as useful alerts to set up. We will also extend this dashboard with system resource metrics, unlocking more insights on root cause analysis and forensic investigations.
In the meantime, we welcome you to join our Apache Pinot Slack Community to share your experience monitoring distributed systems. Also, make sure you don’t miss this excellent blog by Chinmay Soman on Achieving 99th percentile latency SLA using Apache Pinot.
Thanks to Chinmay Soman.
More resources:
- See our upcoming events: https://www.meetup.com/apache-pinot
- Follow us on Twitter: https://twitter.com/startreedata
- Subscribe to our YouTube channel: https://www.youtube.com/startreedata

