Observability has become a fundamental requirement for modern businesses, enabling teams to ensure uptime, optimize performance, and rapidly diagnose issues across distributed systems. However, many companies are frustrated with the status quo—rising costs, vendor lock-in, and overly complex platforms have turned observability into a financial and operational burden rather than an asset.
In response, the market is now shifting toward open-source solutions. Open-source technologies such as OpenTelemetry, Apache Kafka, Apache Pinot, and Grafana are leading the way, offering organizations greater flexibility, lower costs, and more control over their data.
This blog explores how to build a powerful, cost-effective observability platform using open-source tools.
The Evolution of Observability: From Monolithic to Open
The breakthrough innovation that sparked the rise of observability was instrumentation agents—lightweight software components that developers could embed in their code to collect real-time system health data. These agents enabled applications to emit metrics, logs, and traces, providing deep visibility into distributed systems.
Before this, monitoring was largely limited to infrastructure-level insights—CPU usage, memory consumption, and network performance. But agents allowed organizations to capture application-specific telemetry, giving engineers a direct window into how their services were behaving. This was a game-changer for IT operations, enabling teams to detect issues faster, optimize performance, and ensure uptime across increasingly complex environments.
Rather than simply going to market as providers of instrumentation agents, early observability vendors saw an opportunity to offer fully packaged, vertically integrated solutions. These platforms didn’t just provide the agents that collected telemetry data—they built entire ecosystems around them, including:
- Collection – Mechanisms to move observability data from applications to a centralized store.
- Storage – Proprietary databases designed to house massive volumes of metrics, logs, and traces.
- Query Engines – Purpose-built systems for searching and analyzing observability data.
- Visualization – Dashboards, reporting interfaces, and automated alerts to help teams monitor and respond to system issues.
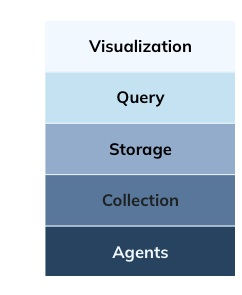
By bundling all these components together, vendors created a monolithic observability stack, making it easier for organizations to get started. However, this approach also came with significant downsides. Customers became locked into proprietary ecosystems, forced to use all-or-nothing solutions that limited flexibility and drove up costs.
As businesses generated more observability data, pricing models that charged based on data volume became increasingly unsustainable, leading many companies to reevaluate their approach. This growing frustration has fueled the current shift toward disaggregated, open-source observability stacks, where organizations can choose the best tool for each layer—without being tied to a single vendor.
Key Open-Source Components for an Observability Platform
A modern observability stack consists of several layers—instrumentation agents, data collection, storage, querying, and visualization. Here’s how open-source tools fit into each layer:
Instrumentation Agents: Standardizing Data Collection with OpenTelemetry
The shift toward open observability has been driven largely by OpenTelemetry (OTel), an open-source standard for instrumenting applications and exporting metrics, logs, and traces.
With OTel, companies can collect observability data without being locked into a specific vendor. It standardizes the process, making it easier to integrate different backends for analysis.
While OpenTelemetry (OTel) has become the dominant force in open-source observability, it’s not the only option. Several other open-source projects address specific telemetry apart from OTel, including Fluentd, Fluent Bit, and Jaeger.
However, despite these alternatives, OTel has captured nearly all the attention in the observability space. As the de facto standard for agents, OTel’s broad adoption across vendors, cloud providers, and open-source projects has made it the go-to solution for collecting and exporting observability data. Its widespread support means that even organizations evaluating other tools often start with OTel as the foundation for their observability strategy.
Data Collection & Transport: Kafka for Scalable Ingestion
Efficiently collecting and moving observability data at scale is one of the most critical challenges organizations face. Given the sheer volume of metrics, logs, and traces generated by modern applications, a robust data transport layer is essential to ensure real-time insights without overwhelming storage and compute resources.
Apache Kafka: The Leading Open-Source Choice
Apache Kafka has become the de facto standard for streaming observability data. As a highly scalable, distributed event streaming platform, Kafka excels at:
- Handling massive data throughput – Kafka can ingest millions of events per second with low latency.
- Decoupling data producers and consumers – Observability data flows seamlessly from applications to storage and analysis layers without direct dependencies.
- Providing fault tolerance and scalability – Kafka’s distributed architecture ensures data durability and high availability.
Many organizations rely on Kafka to transport observability data from OpenTelemetry (OTel) agents and other sources to backend database sinks like Apache Pinot, ClickHouse, or Elasticsearch for analysis. However, while Kafka is widely adopted, it’s not the only option:
- Redpanda – A Kafka-compatible streaming platform designed for lower latency and reduced operational overhead. Redpanda eliminates the need for Zookeeper and provides a more lightweight, single-binary deployment. Organizations looking for Kafka’s capabilities without the maintenance complexity often turn to Redpanda.
- Amazon Kinesis – A fully managed streaming service that integrates natively with AWS. While Kinesis lacks Kafka’s open-source flexibility, it’s a compelling option for AWS-centric observability architectures, offering built-in autoscaling and tight integration with AWS services like Lambda and S3.
- Pulsar – Apache Pulsar is another Kafka alternative that offers multi-tenancy and geo-replication out of the box, making it attractive for organizations with globally distributed infrastructure.
Storage & Querying: The Role of Apache Pinot
The storage and query layer is a critical battleground for open-source observability. While solutions like Prometheus and ClickHouse have gained some traction, they each have limitations:
- Prometheus is great for real-time metrics but struggles with large-scale data and lacks native log or trace support.
- ClickHouse performs well for log-based queries but is inefficient for real-time workloads. Many users point to high costs due to the way tiered storage is architected and the way ClickHouse pushes data management to the query engine versus during the ingest process. ClickHouse also lacks full integration with Grafana for PromQL workloads.
This is where Apache Pinot comes in. Originally developed at LinkedIn to power real-time analytics at massive scale, Pinot is a columnar database purpose-built for sub-second querying on high-cardinality data—a critical capability for observability workloads. Unlike traditional observability platforms that struggle with high-concurrency queries, real-time ingestion, and efficient storage, Pinot was designed from the ground up to handle millions of queries per second while keeping infrastructure costs low.
Pinot’s architecture is optimized for real-time data ingest and rapid querying, making it uniquely suited for observability:
- Time-Series Analytics at Scale – Contributions from Uber have optimized Pinot for handling large-scale time-series workloads, making it an ideal backend for storing and analyzing real-time metrics, logs, and traces. Pinot efficiently compresses and indexes time-series data for fast lookups, reducing query latencies even on massive datasets.
- PromQL Support for Seamless Integration – Pinot now integrates with Prometheus Query Language (PromQL), allowing users to leverage familiar query syntax while gaining Pinot’s performance and scale advantages. This enables real-time observability dashboards in Grafana without major rewrites.
- Unified Observability Across Metrics, Logs, and Traces – Unlike legacy observability platforms that store different types of telemetry in separate silos, Pinot provides a single platform for analyzing all observability data. This eliminates the inefficiencies of querying across fragmented data stores and enables fast, correlated insights across logs, metrics, and traces.
- Hyper-Efficient Compute and Storage – Pinot was designed to maximize performance while minimizing resource consumption. Features like columnar storage, real-time indexing, and segment-level pruning dramatically reduce query latencies without overloading compute resources. By efficiently handling petabyte-scale observability data, Pinot significantly lowers infrastructure costs compared to traditional observability databases.
Visualization: Grafana Leads, but Other Options in Play
Observability data is only as valuable as the insights it provides, which is why visualization tools play a critical role in any observability stack. Dashboards help teams analyze trends, identify anomalies, and correlate logs, metrics, and traces to troubleshoot issues effectively.
Grafana: The Gold Standard for Observability Dashboards
Grafana has become the dominant open-source visualization platform, widely adopted for its:
- Broad Compatibility – Grafana integrates seamlessly with data sources like Prometheus, Apache Pinot, Loki, Elasticsearch, and OpenTelemetry, making it a versatile choice.
- Real-Time and Historical Analysis – Teams can monitor real-time system health while also analyzing long-term trends.
- Flexible Querying & Custom Dashboards – Grafana’s intuitive UI and support for PromQL, SQL, and JSON-based queries allow deep customization.
- Alerting & Automation – Built-in alerting features notify teams when system metrics exceed predefined thresholds.
Because Grafana is vendor-neutral and extensible, it’s a go-to choice for organizations building disaggregated observability stacks. However, while Grafana dominates, it’s not the only open-source visualization tool available.
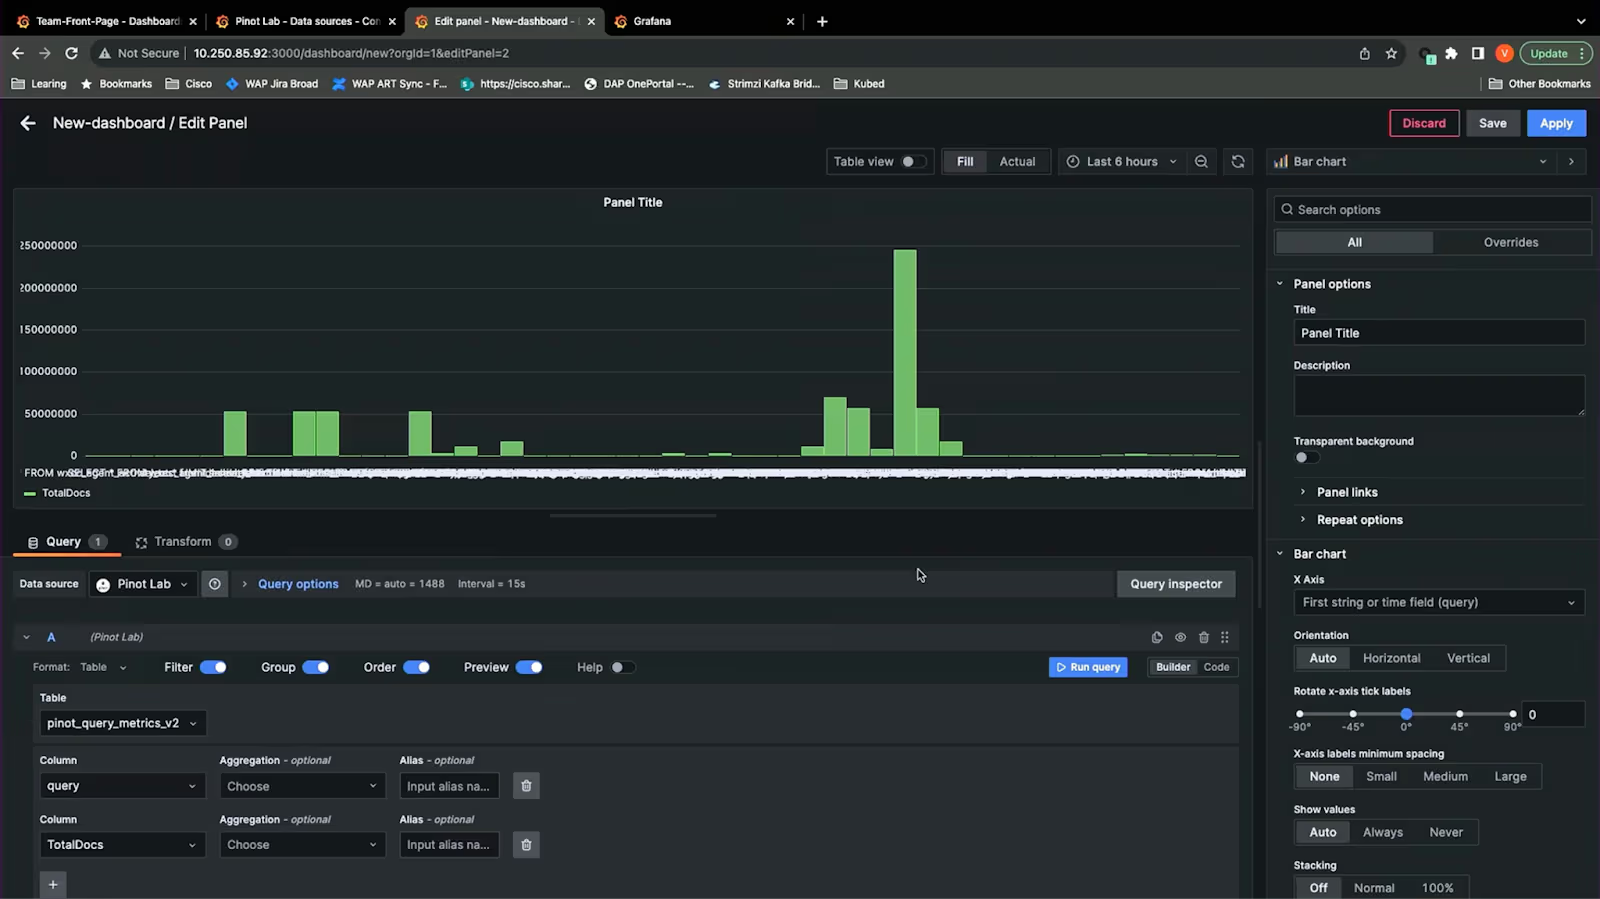
Cisco’s Grafana Dashboard with StarTree, Powered by Apache Pinot datastore.
Other Open-Source Visualization Options
While Grafana is often the default choice, some organizations explore alternatives that cater to specific needs:
- Apache Superset – A business intelligence (BI) tool that competes more directly with proprietary BI solutions like Tableau and Looker. Superset is better suited for exploratory data analysis and ad hoc SQL-based querying rather than low-latency observability dashboards, but some teams use it to visualize observability data stored in Pinot or ClickHouse.
- Kibana – Part of the ELK stack (Elasticsearch, Logstash, Kibana), Kibana is optimized for log analysis and search-heavy observability use cases. While it lacks Grafana’s real-time monitoring focus, it’s an excellent choice for organizations that heavily rely on Elasticsearch for log storage.
- Metabase – Another BI-focused open-source tool, Metabase is a good fit for teams needing simple, easy-to-use query interfaces for observability analytics. While not a replacement for Grafana, some teams use Metabase to create high-level reports on observability data.
Making Open Source Enterprise-Ready: Managed Solutions and Expert Support
While pure open-source observability stacks offer unmatched flexibility and cost savings, managing them at scale can be daunting—especially for teams without deep expertise in deployment, tuning, and maintenance. Open-source technologies often require significant operational effort, from ensuring high availability to managing upgrades and optimizing performance. To bridge this gap, several vendors provide enterprise-grade solutions that make open-source tools more usable, reliable, and scalable. These companies offer managed services, enterprise support, and deep expertise from core committers, ensuring organizations can focus on insights rather than infrastructure. Examples include:
- Confluent for Apache Kafka -which simplifies real-time data streaming with a fully managed cloud service
- StarTree for Apache Pinot – providing a managed real-time analytics platform with enhanced performance and enterprise features
- Grafana Labs – which offers a commercial version of Grafana with advanced security, scalability, and support.
These vendors allow businesses to leverage the power of open source without the operational headaches, making it easier to deploy and maintain observability at scale.
In Sum
The observability market is shifting away from monolithic, vendor-locked solutions toward flexible, open-source platforms. With OpenTelemetry, Kafka, Apache Pinot, and Grafana, companies can build a powerful observability stack that is cost-efficient, scalable, and free from vendor constraints.
By adopting an open approach, organizations can future-proof their observability strategy—ensuring better performance, lower costs, and greater control over their data.