
In part 1 of this blog series, we looked at how a star-tree index brought down standalone query latency on a sizable dataset of ~633M records from 1,513ms to 4ms! — nearly 380x faster.
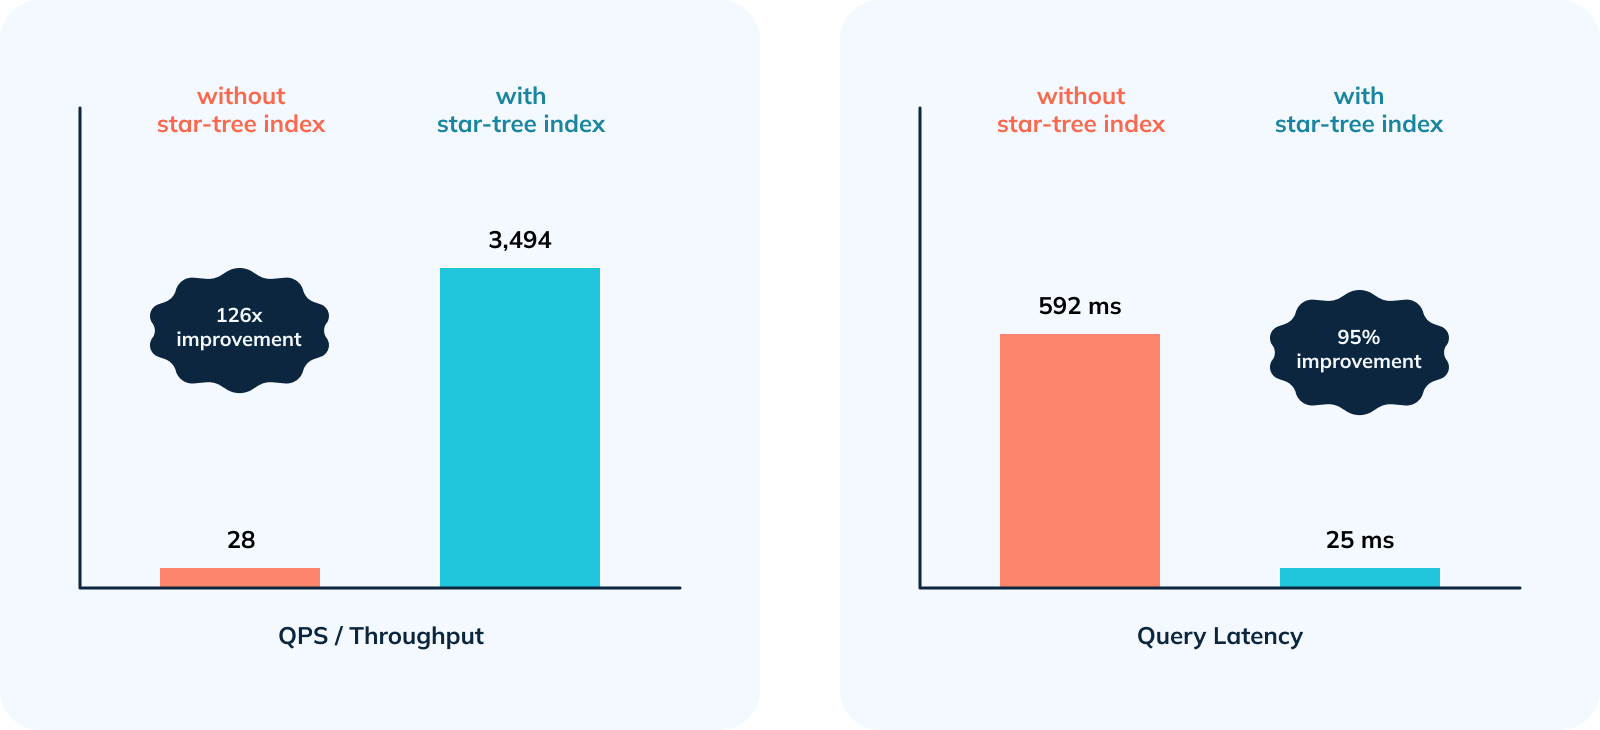
In this blog, we imitate a real production scenario by firing hundreds of concurrent queries using JMeter and showcase how using a star-tree index helped achieve a > 95% drop in p90th / p95th / p99th latencies and 126 x increase in Throughput.
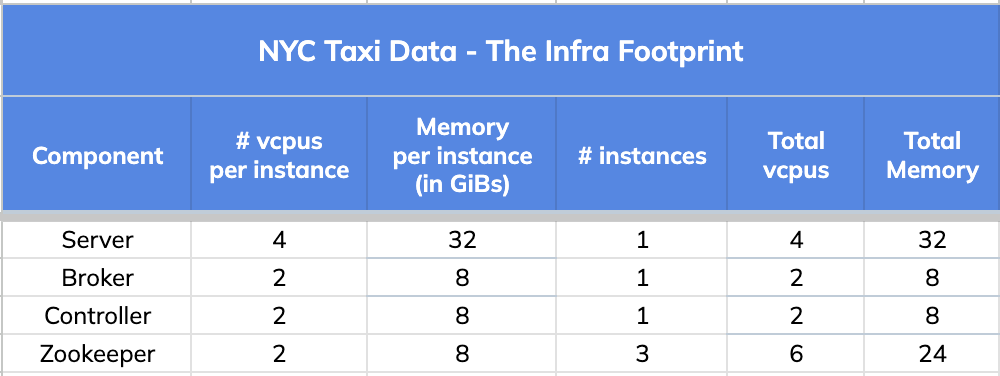
1. The Infra Footprint
We started with the same infra footprint used in the previous exercise with a goal to maximize throughput and resource utilization on the 4 vCPU Pinot Server.
2. JMeter Config
We ran JMeter Client in standalone mode on a 4 vCPU Amazon EC2 Instance (m5.xlarge).
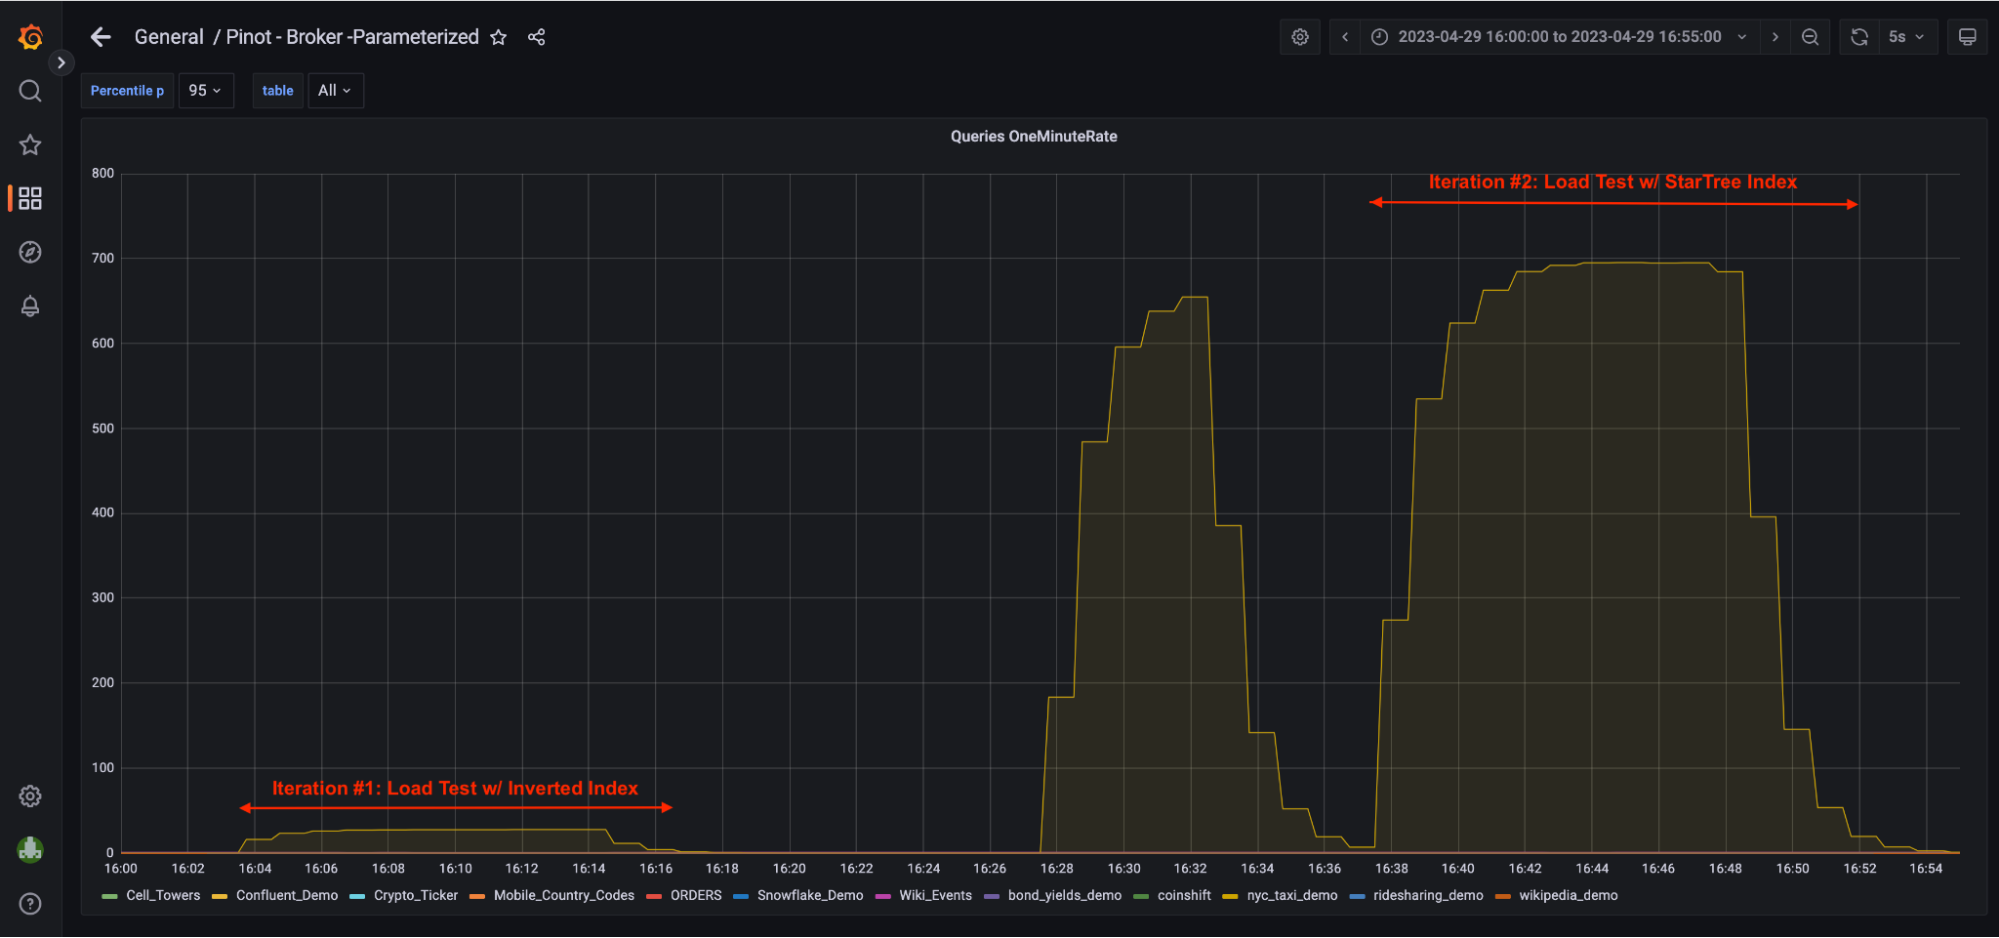
We ran three throughput tests, the first with an inverted index and the second and third with a star-tree index.
- Ramp Up = 1 minute
- Hold = 10 minutes
- Total Load Test Runtime = 11 minutes
- Concurrent Threads = 16 (iteration #1), 64 (iteration #2), 64 (iteration #3)
3. Load Test Query Results and Stats
We used the same query from the previous blog with a minor variation. This time, we used a more commonly used shorter time filter of 7 days.
Iteration #1: w/ Inverted Index:
-- Iteration #1: w/ Inverted Index SELECT dropoff_date_str "Date", count(*) "Total # of Trips", sum(trip_distance) "Total distance traveled", sum(passenger_count) "Total # of Passengers", sum(total_amount) "Total Revenue" FROM nyc_taxi_demo WHERE "Date" BETWEEN '2015-01-01' AND '2015-01-07' GROUP BY "Date" ORDER BY "Date" ASC limit 1000 option(useStarTree=false, timeoutMs=20000)Code language: PHP (php)We ran this test with 16 concurrent threads .
JMeter Report:
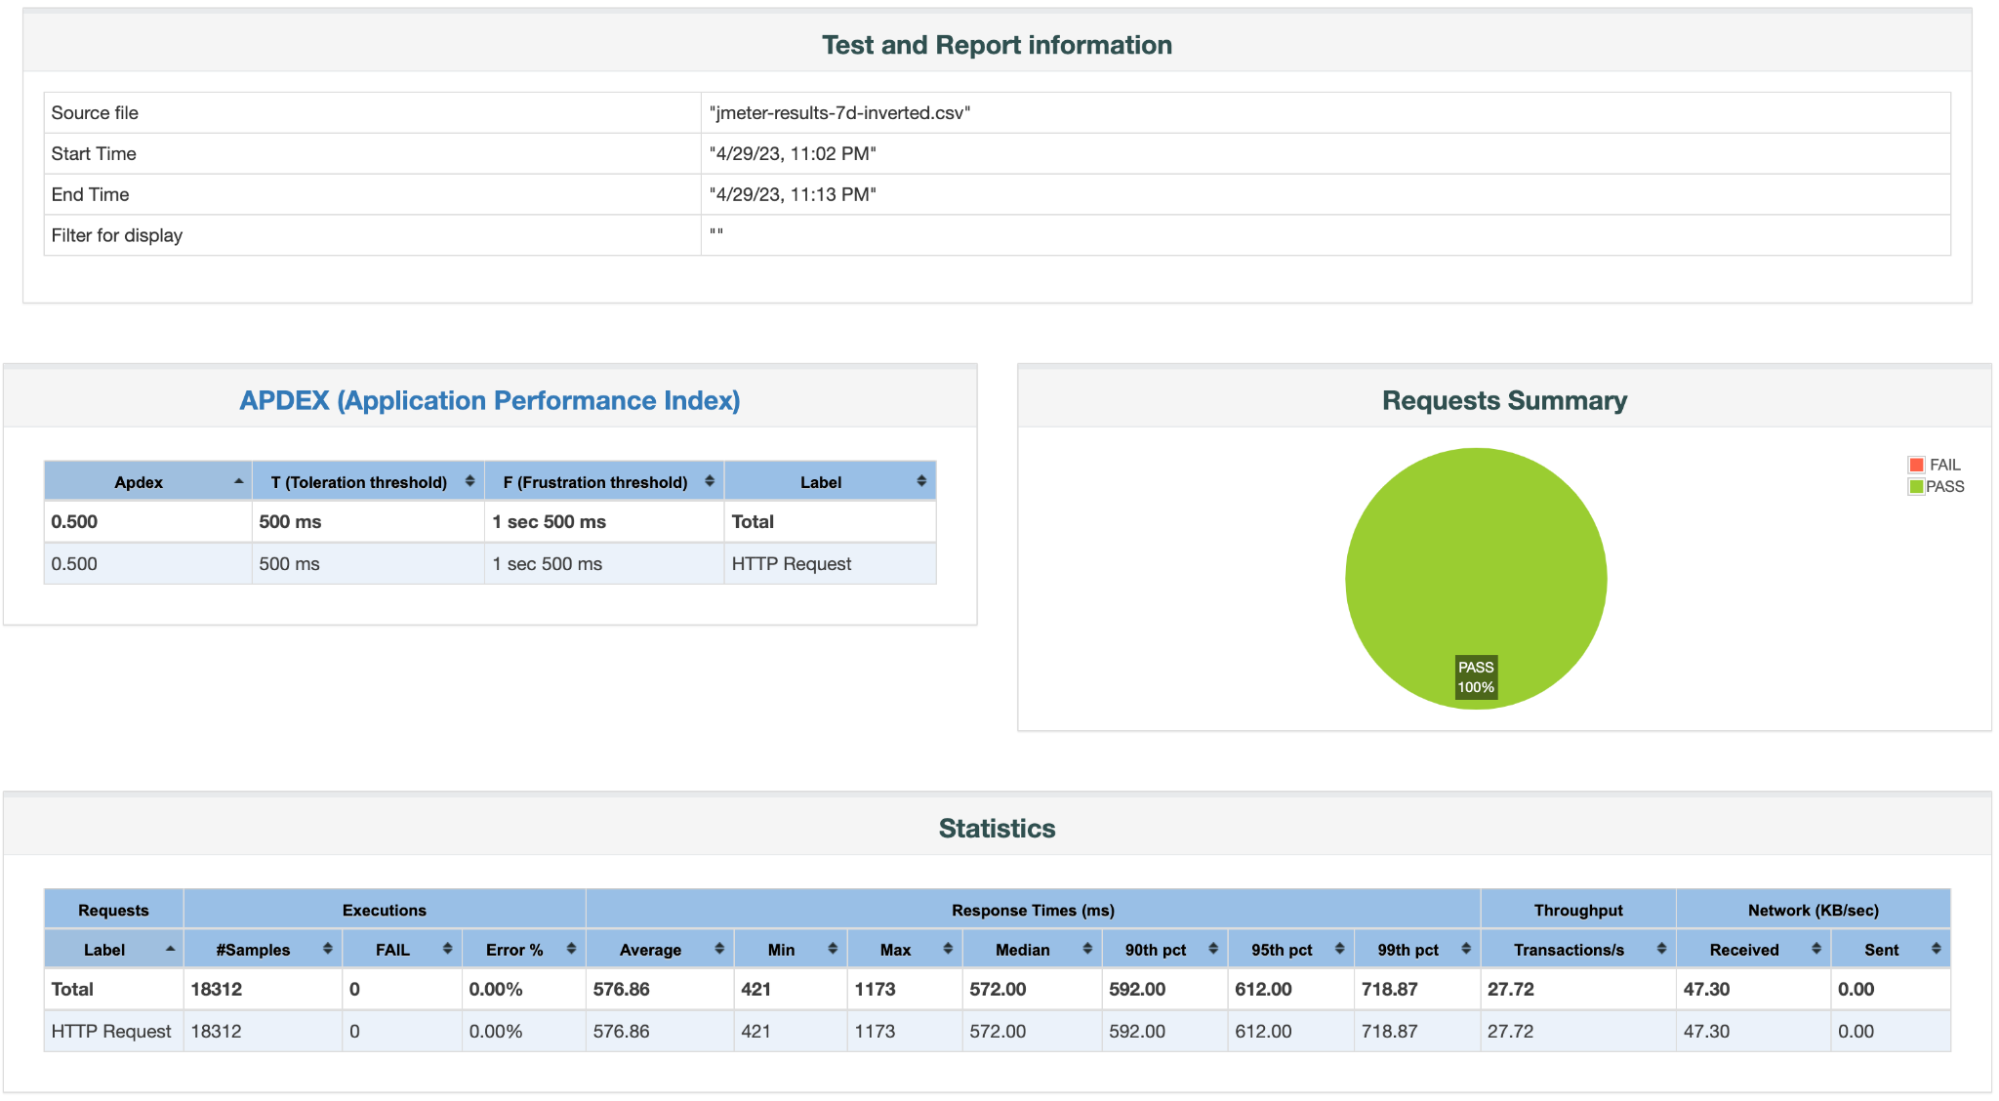
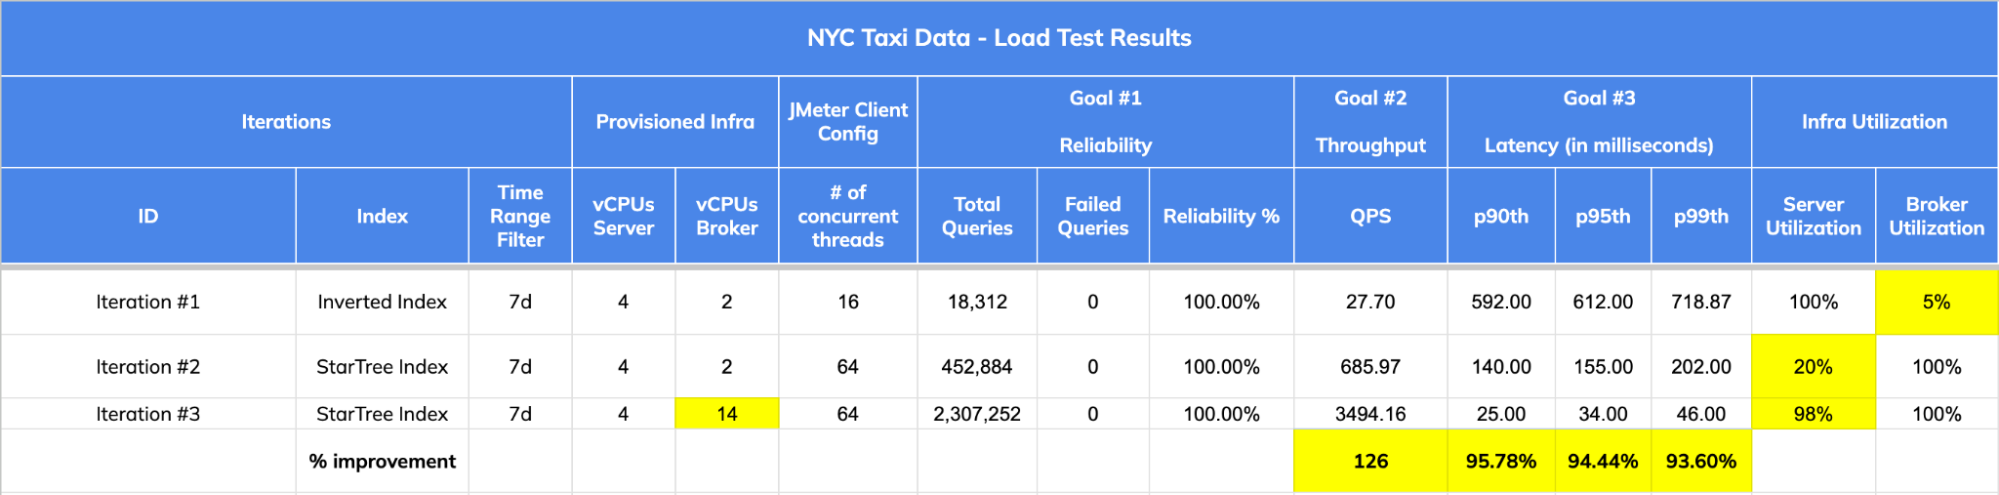
Load Test Results Summary:
1. Reliability = 100%
- Total # of Queries = 18,312
- Total # of Failed Queries = 0
2. Throughput / QPS = 27.72
3. Latencies:
- p90th latency = 592 ms
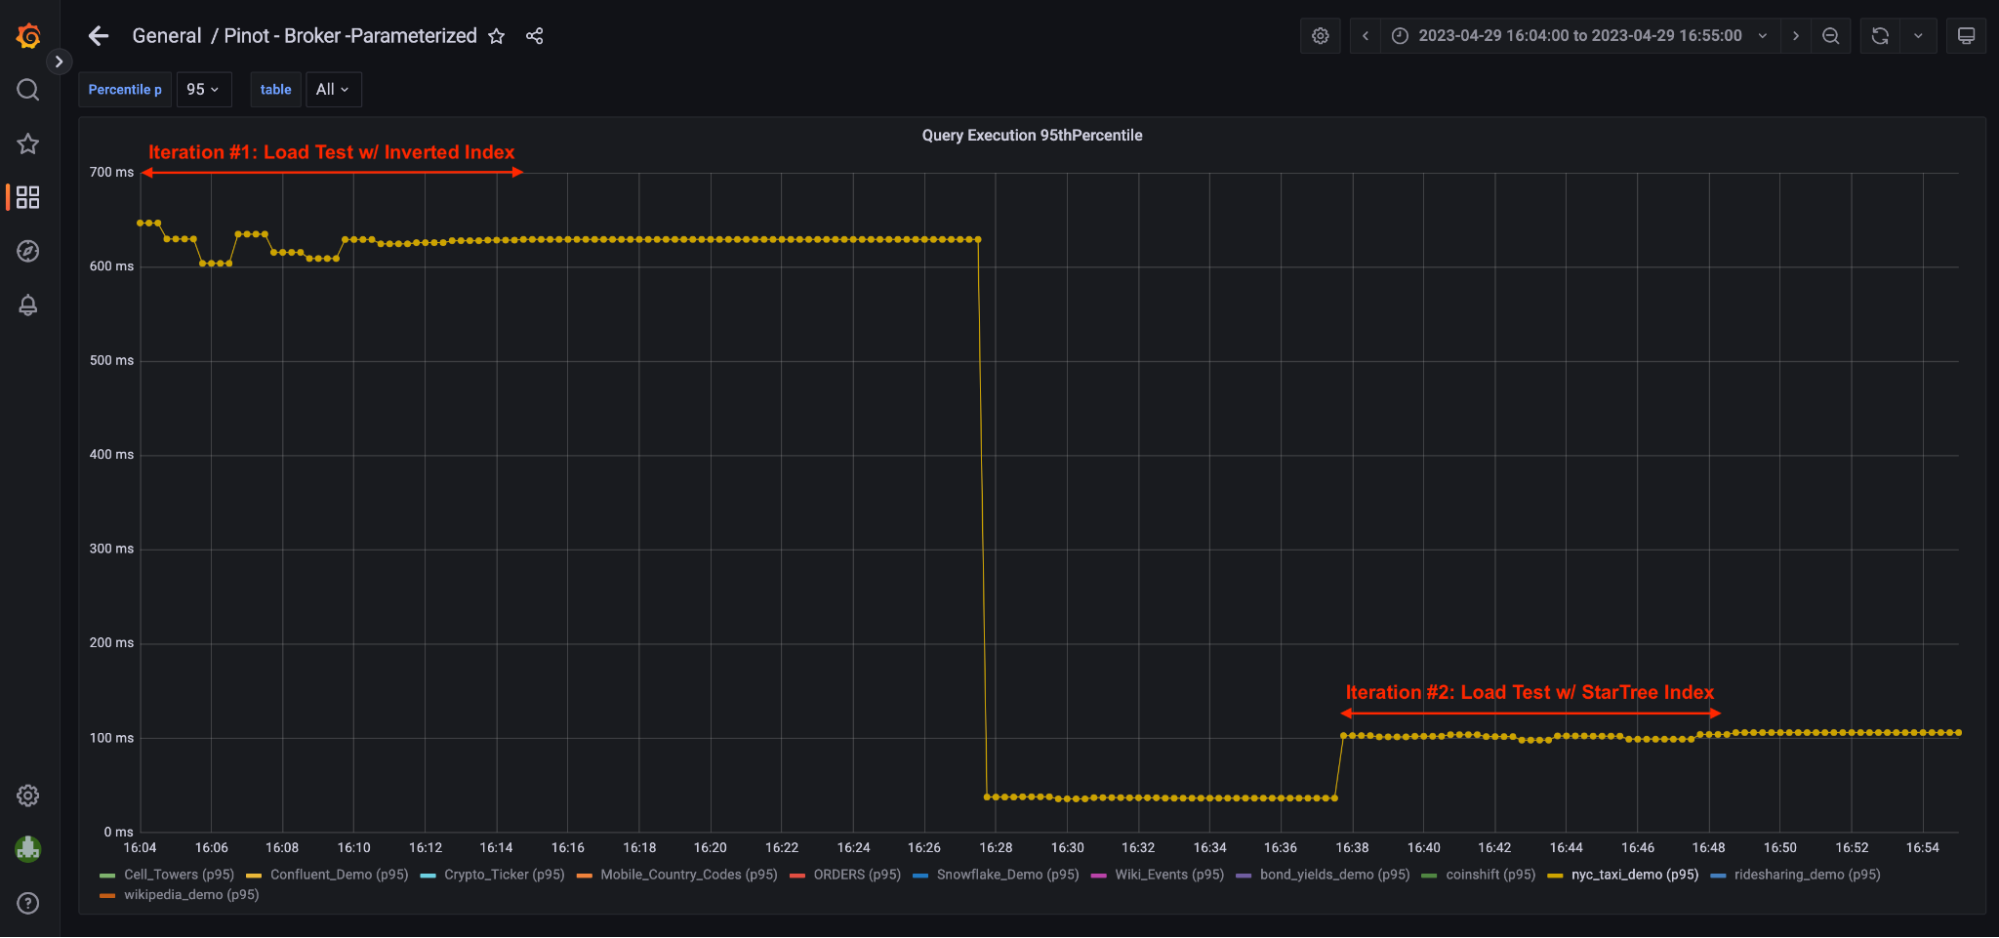
- p95th latency = 612 ms
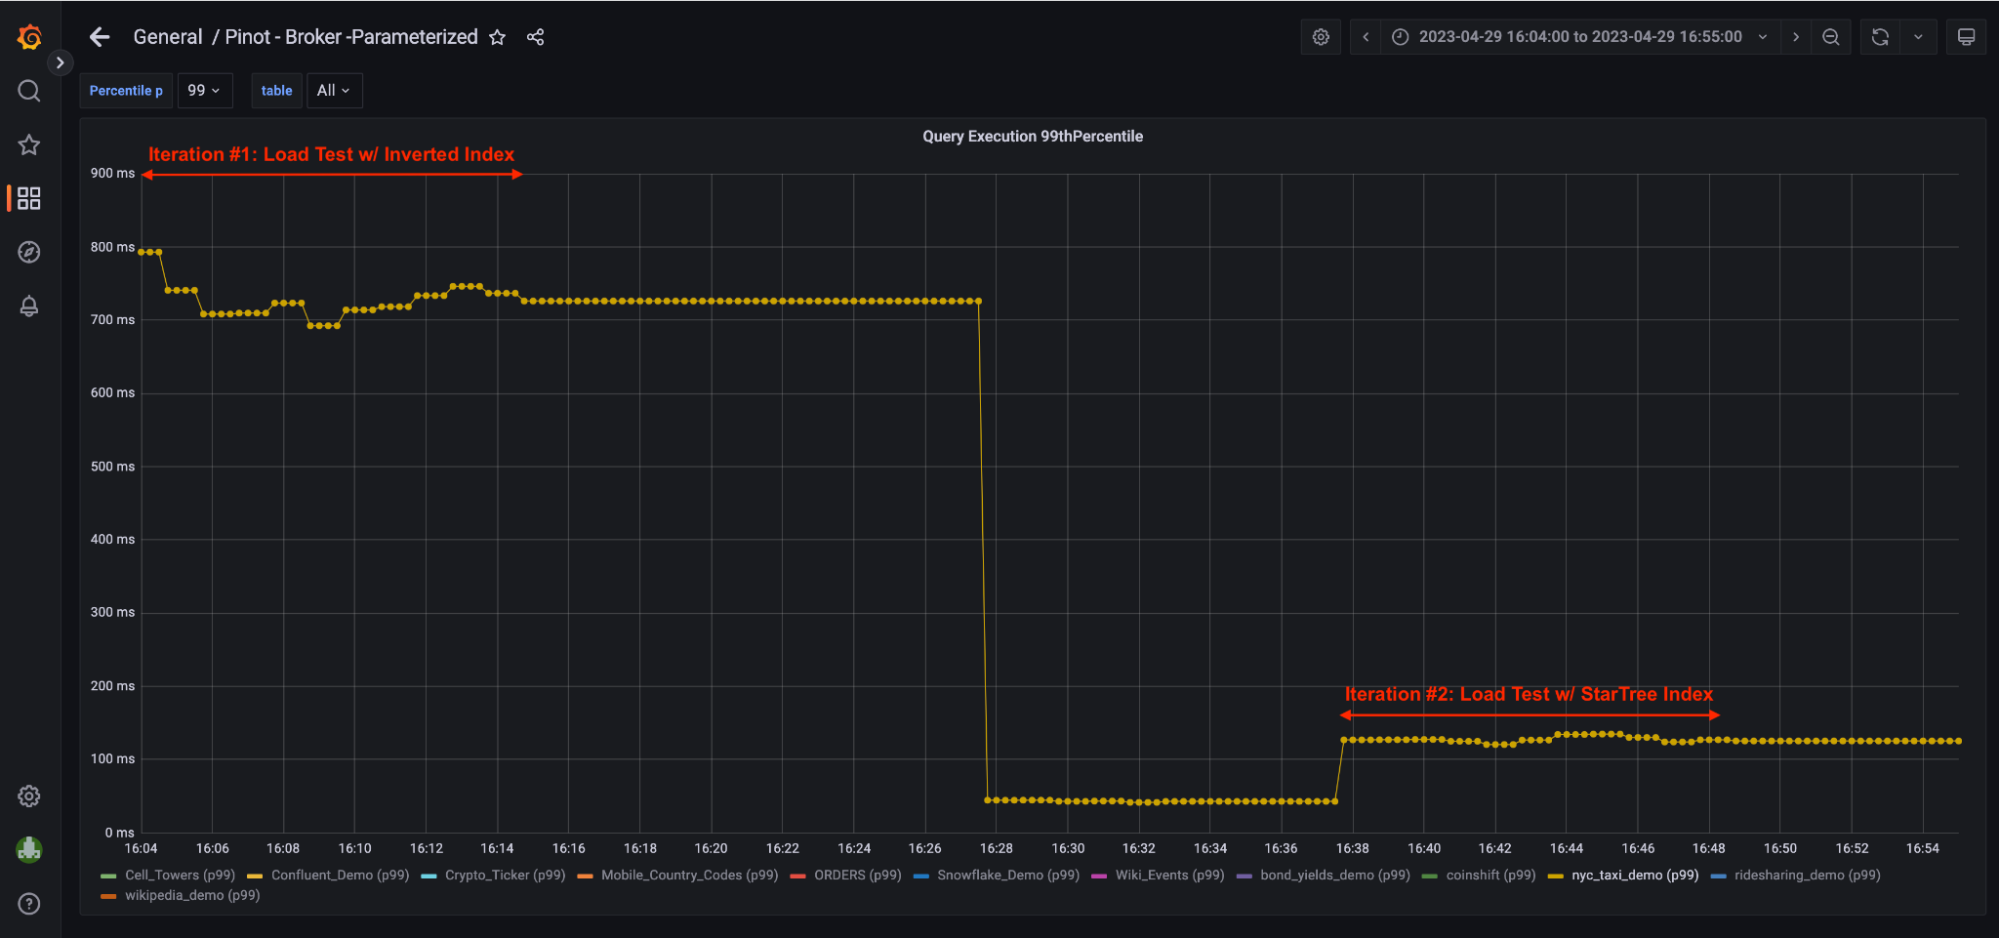
- p99th latency = 718.87 ms
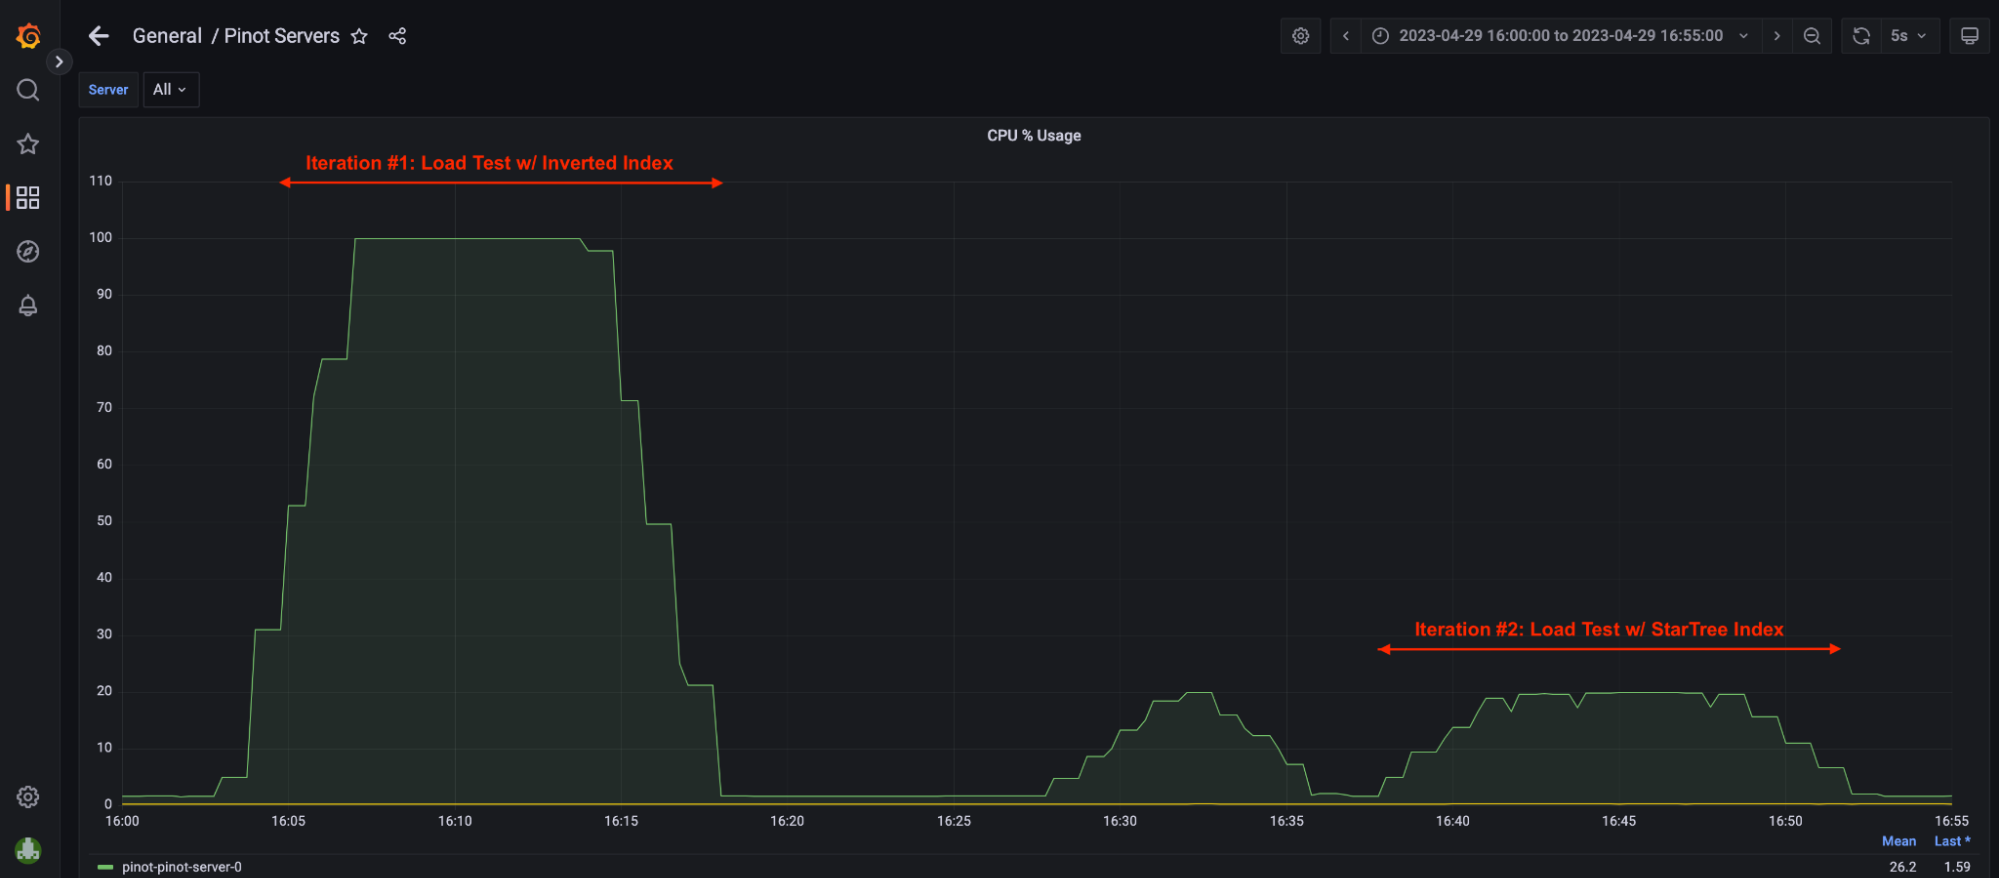
4. Server Utilization = ~100% <- screenshot in Grafana Dashboard section
- Pinot Server CPU utilization had reached ~100% so there was no room to take in more QPS.
5. Broker Utilization = ~5% <- screenshot in Grafana Dashboard section
- Pinot Broker CPU utilization was only under 5%, which meant that the Broker was underutilized and had the capacity to take in more QPS however, that was not possible without scaling up Pinot Server capacity.
Iteration #2: w/ Star-Tree Index:
-- Iteration #2: w/ StarTree Index SELECT dropoff_date_str "Date", count(*) "Total # of Trips", sum(trip_distance) "Total distance traveled", sum(passenger_count) "Total # of Passengers", sum(total_amount) "Total Revenue" FROM nyc_taxi_demo WHERE "Date" BETWEEN '2015-01-01' AND '2015-01-07' GROUP BY "Date" ORDER BY "Date" ASC limit 1000 option(useStarTree=true, timeoutMs=20000)Code language: PHP (php)Copy
We ran this test with 64 concurrent threads .
JMeter Report:
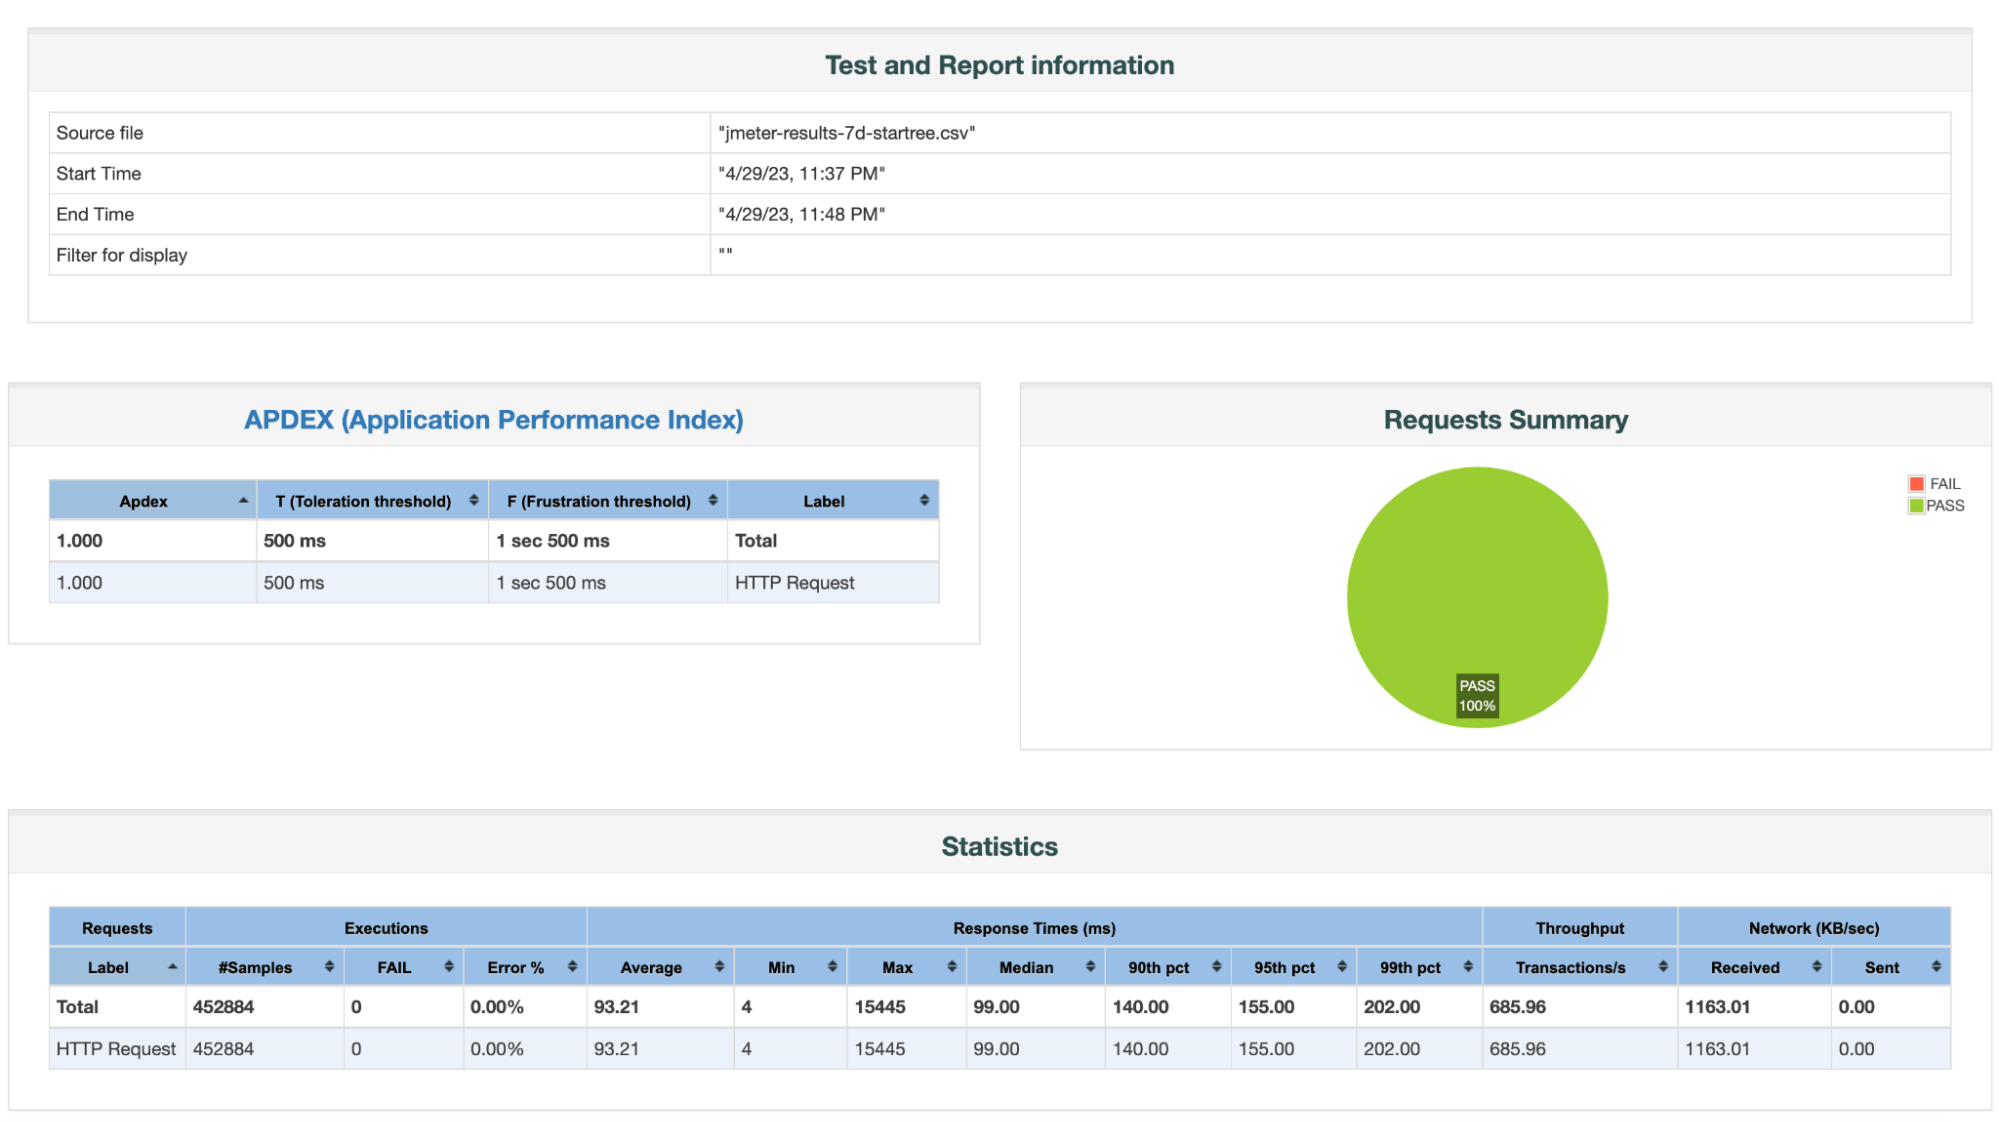
Load Test Results Summary:
1. Reliability = 100%
- Total # of Queries = 452,884
- Total # of Failed Queries = 0
2. Throughput / QPS = 685.96; Compared to a throughput of 27 w/ Inverted Index, that’s 25x increase in throughput.
3. Latencies:
- p90th latency = 140 ms
- p95th latency = 155 ms; Compared to 612 ms w/ Inverted Index, that’s 74.67% reduction in p95th.
- p99th latency = 202 ms; Compared to 718 ms w/ Inverted Index, that’s 71.90% reduction.
4. Broker Utilization = ~100%; In this iteration, Pinot Broker CPU utilization was at 100%, which meant that the Broker was fully utilized and did not have capacity to take in more QPS.
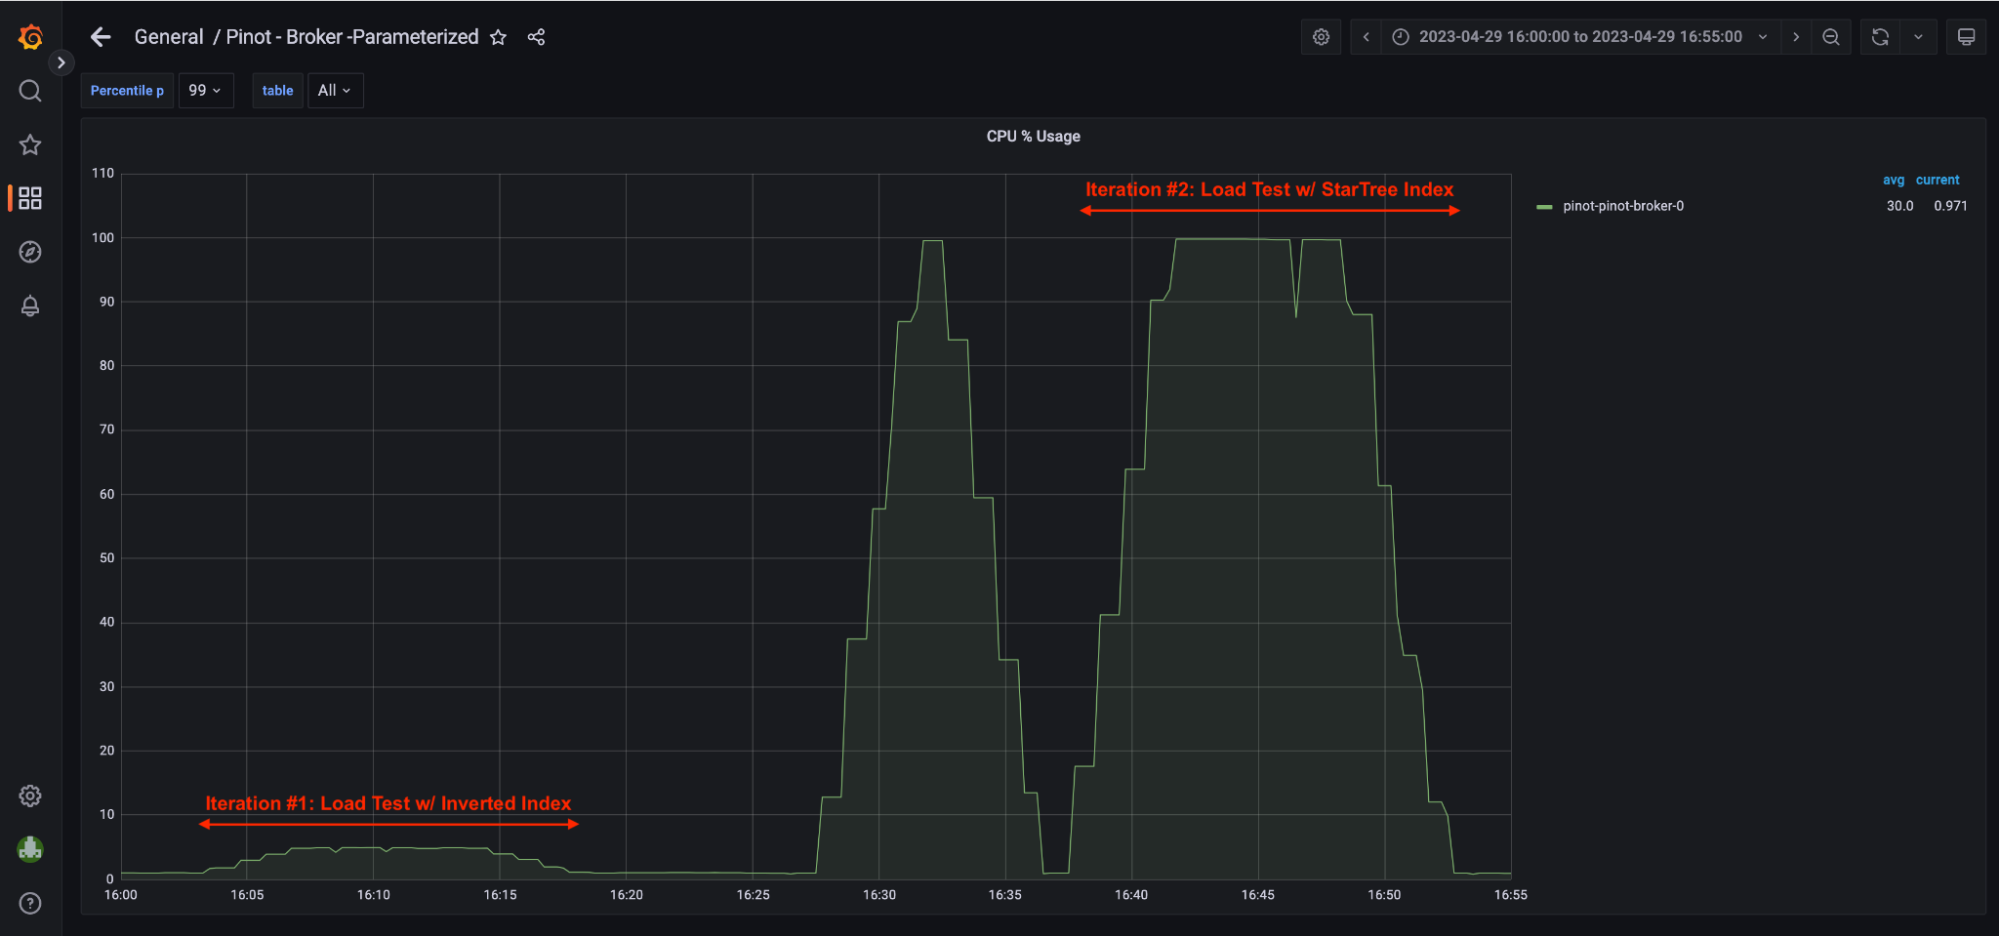
5. Server Utilization = ~20% <- screenshot in Grafana Dashboard section. In this iteration, Pinot Server CPU utilization was only at 20%.
- In theory, this single 4 vcpu Pinot Server could handle roughly 5x more throughput assuming the query pattern remained the same. Of course, we would have to scale brokers to support this higher throughput.
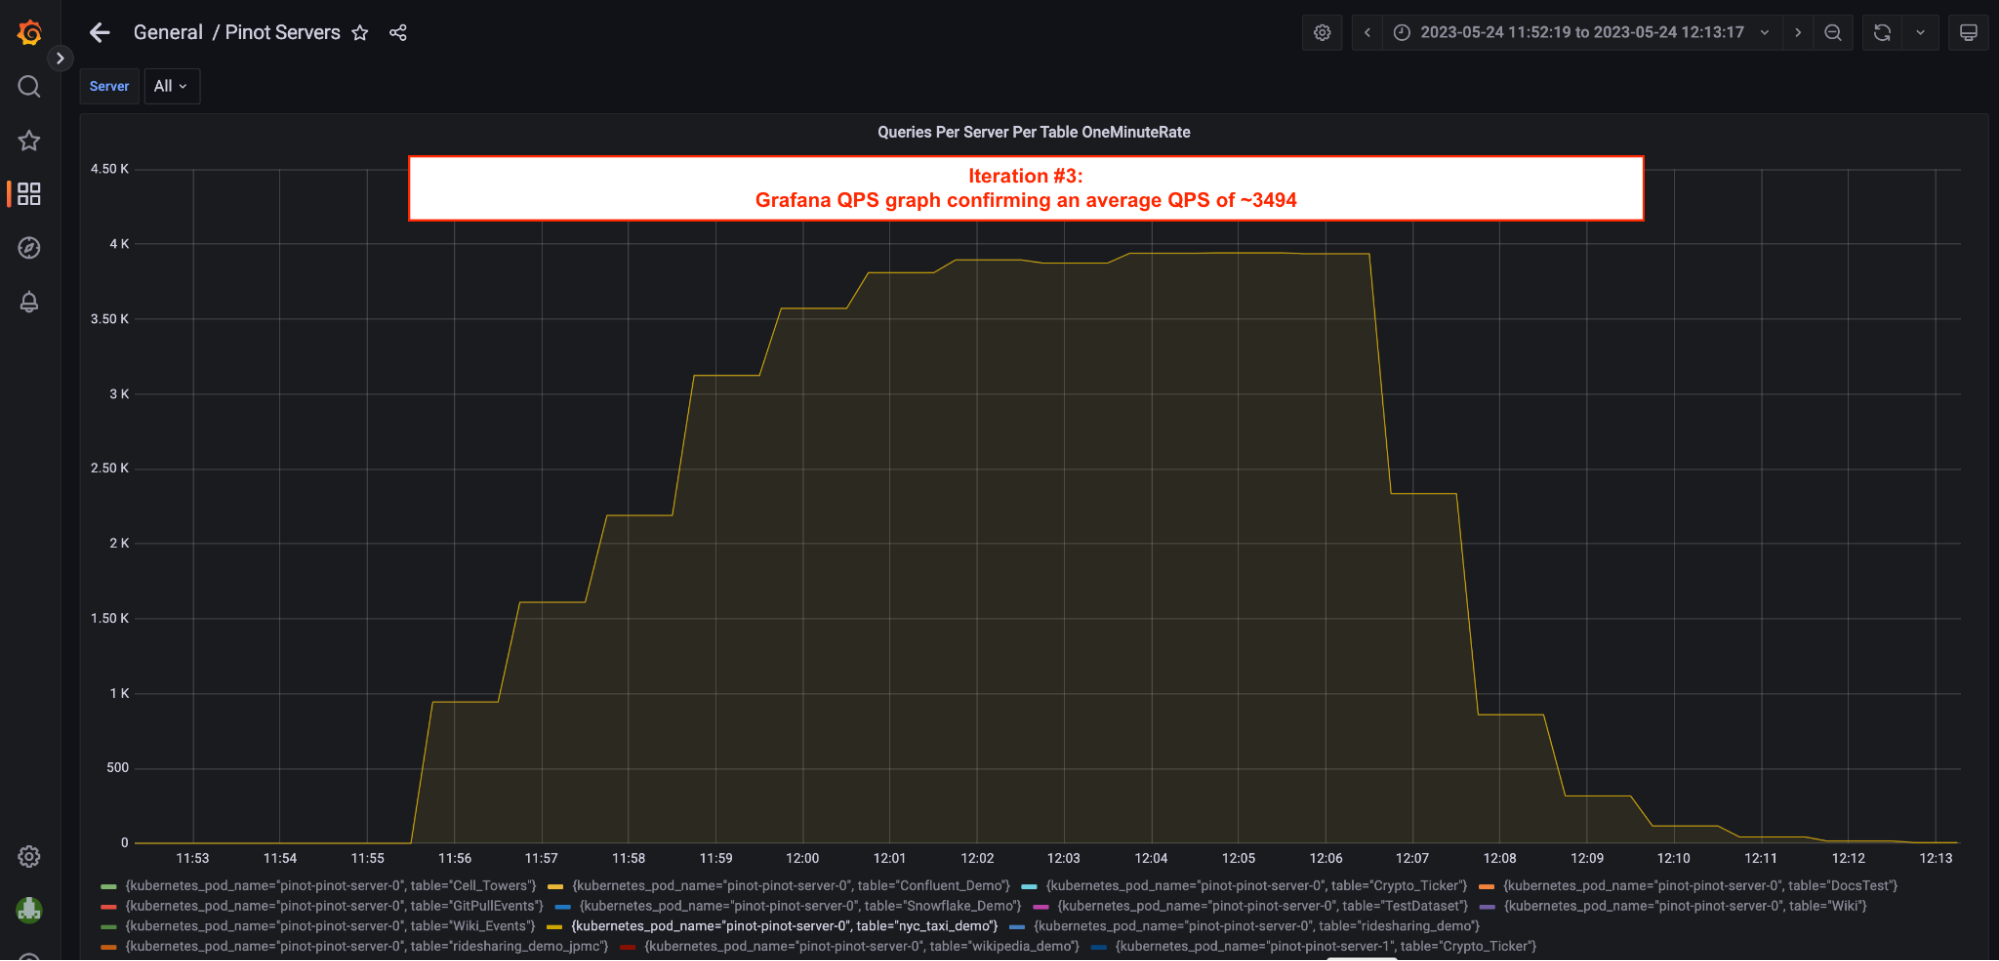
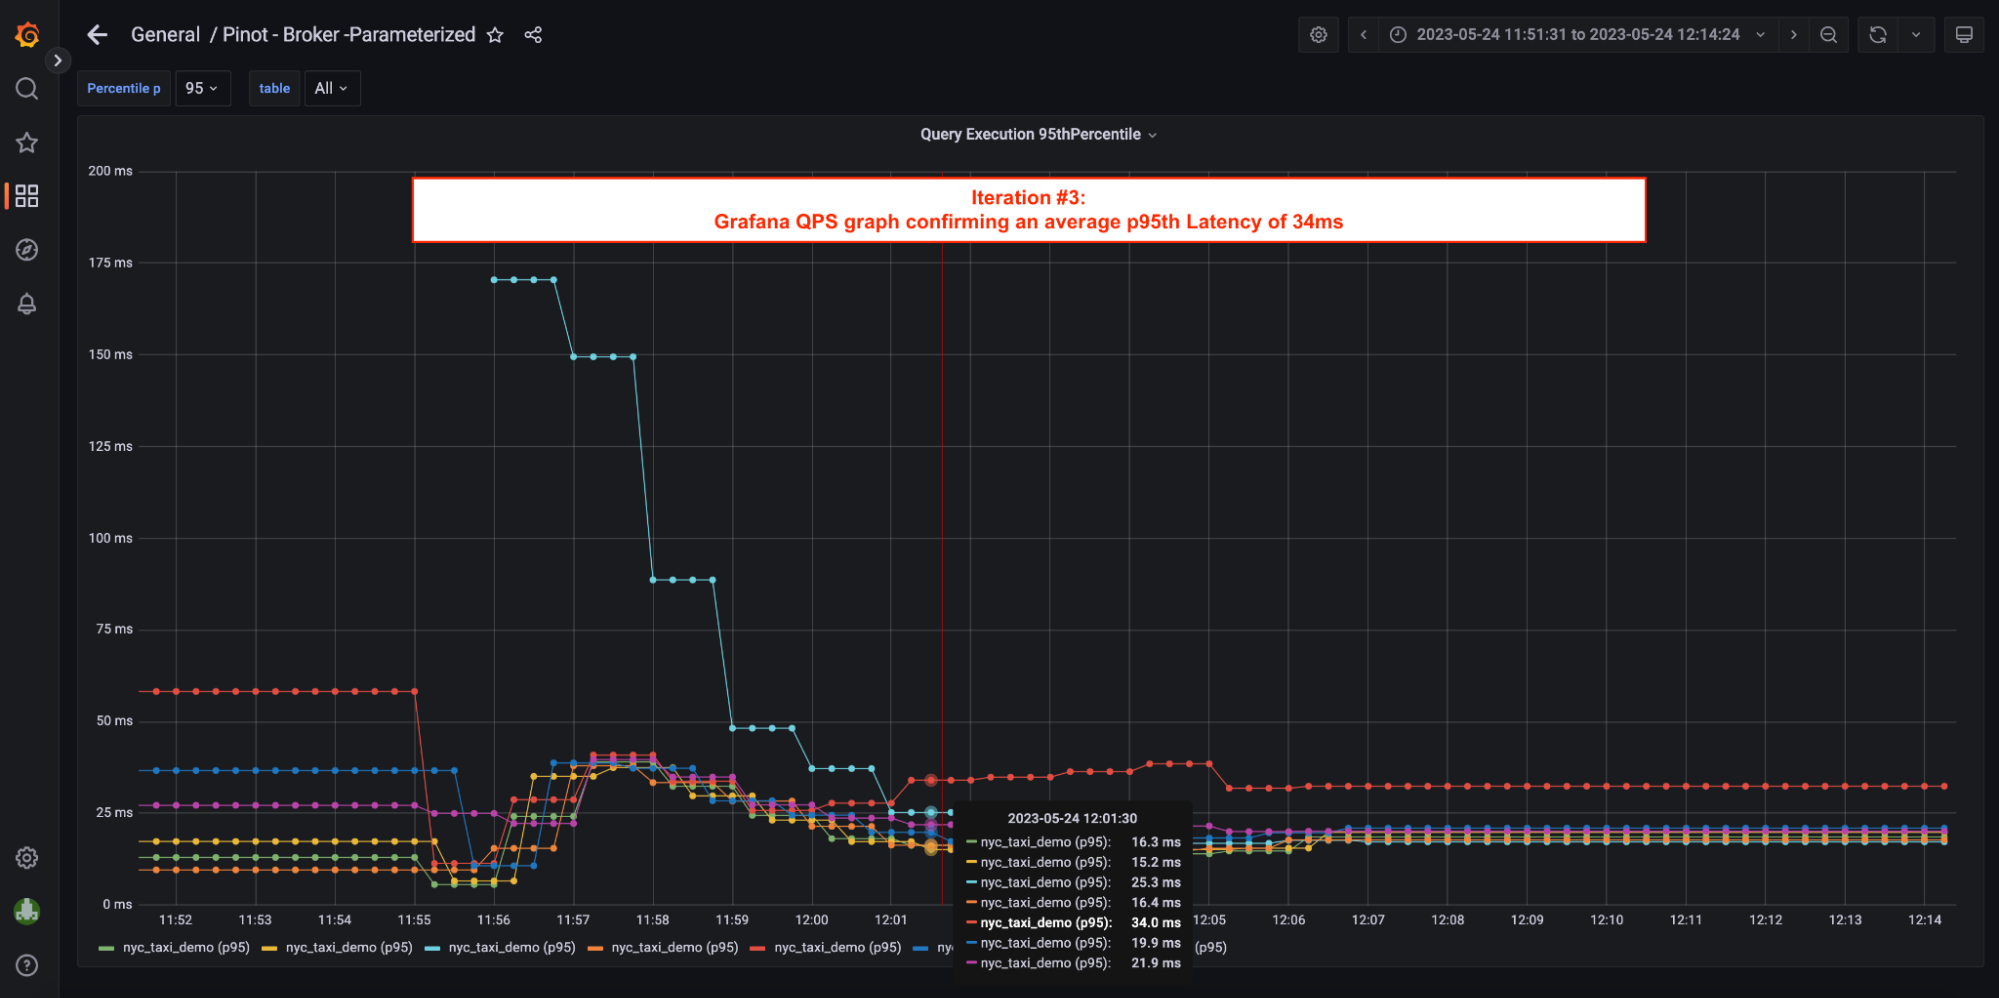
Iteration #3: w/ Star-Tree Index:
In this iteration, we increased broker capacity by 7x and ran load test with 64 concurrent threads .
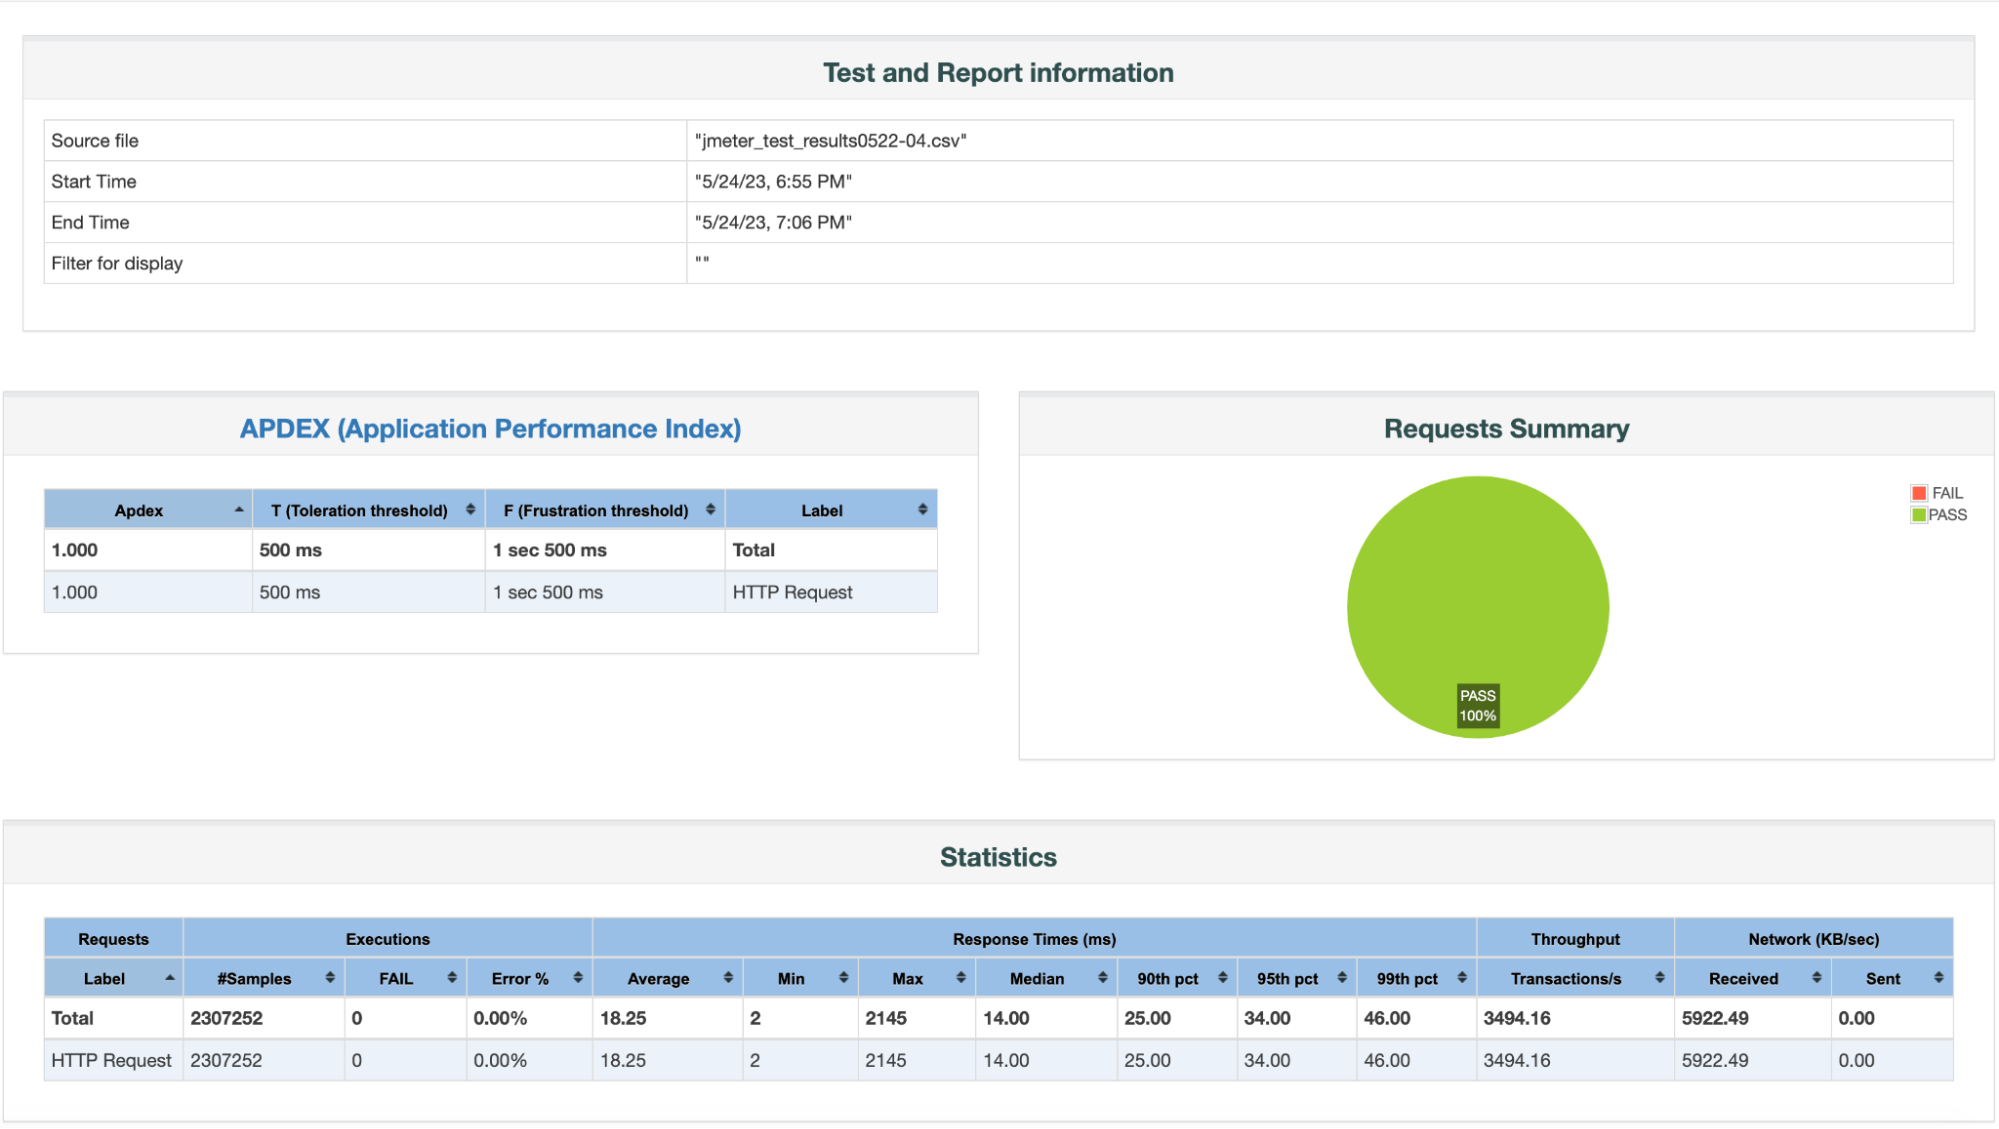
JMeter Report:
Load Test Results Summary:
1. Reliability = 100%
- Total # of Queries = 2,307,252
- Total # of Failed Queries = 0
2. Throughput / QPS = 3,494.16; Compared to a throughput of 27 w/ Inverted Index; that’s a 126 x increase in throughput.
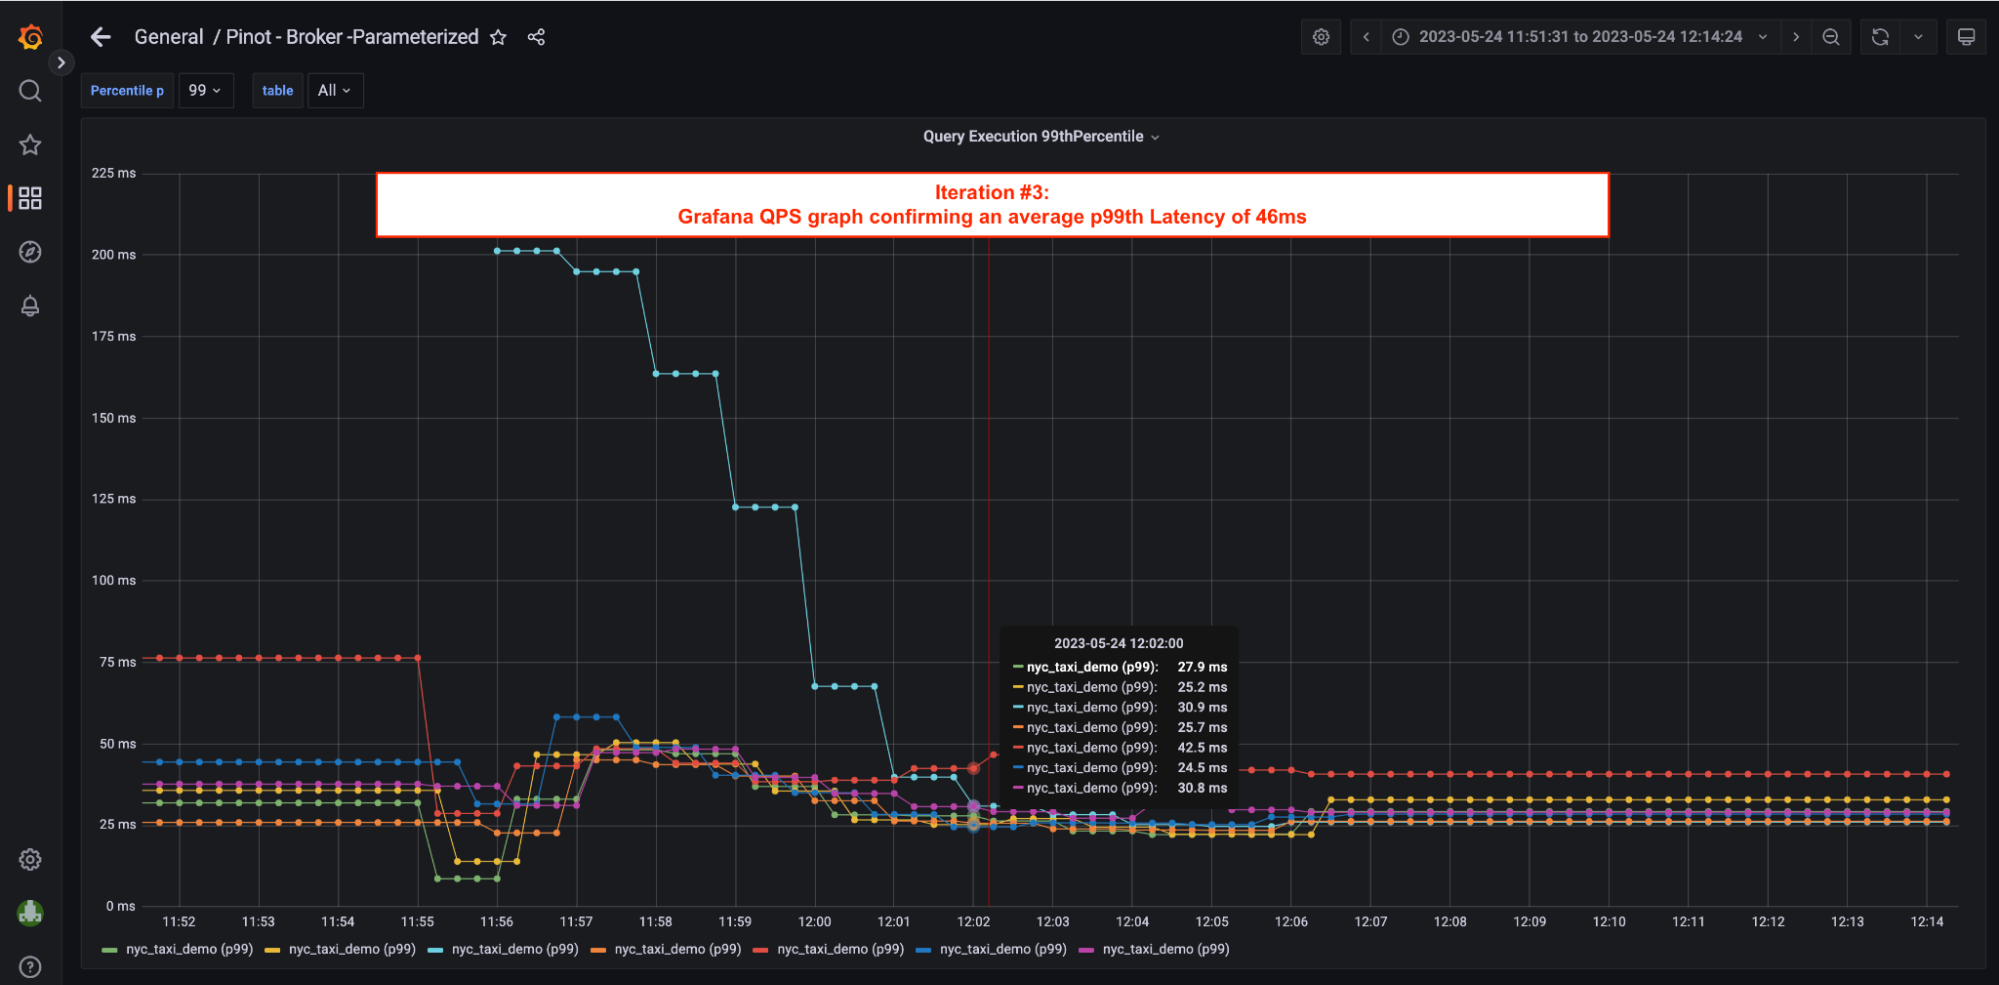
3. Latencies:
- p90th latency = 25 ms
- p95th latency = 34 ms; Compared to 612 ms w/ Inverted Index, that’s 94.44% reduction in p95th.
- p99th latency = 46 ms; Compared to 718 ms w/ Inverted Index, that’s 93.60% reduction.
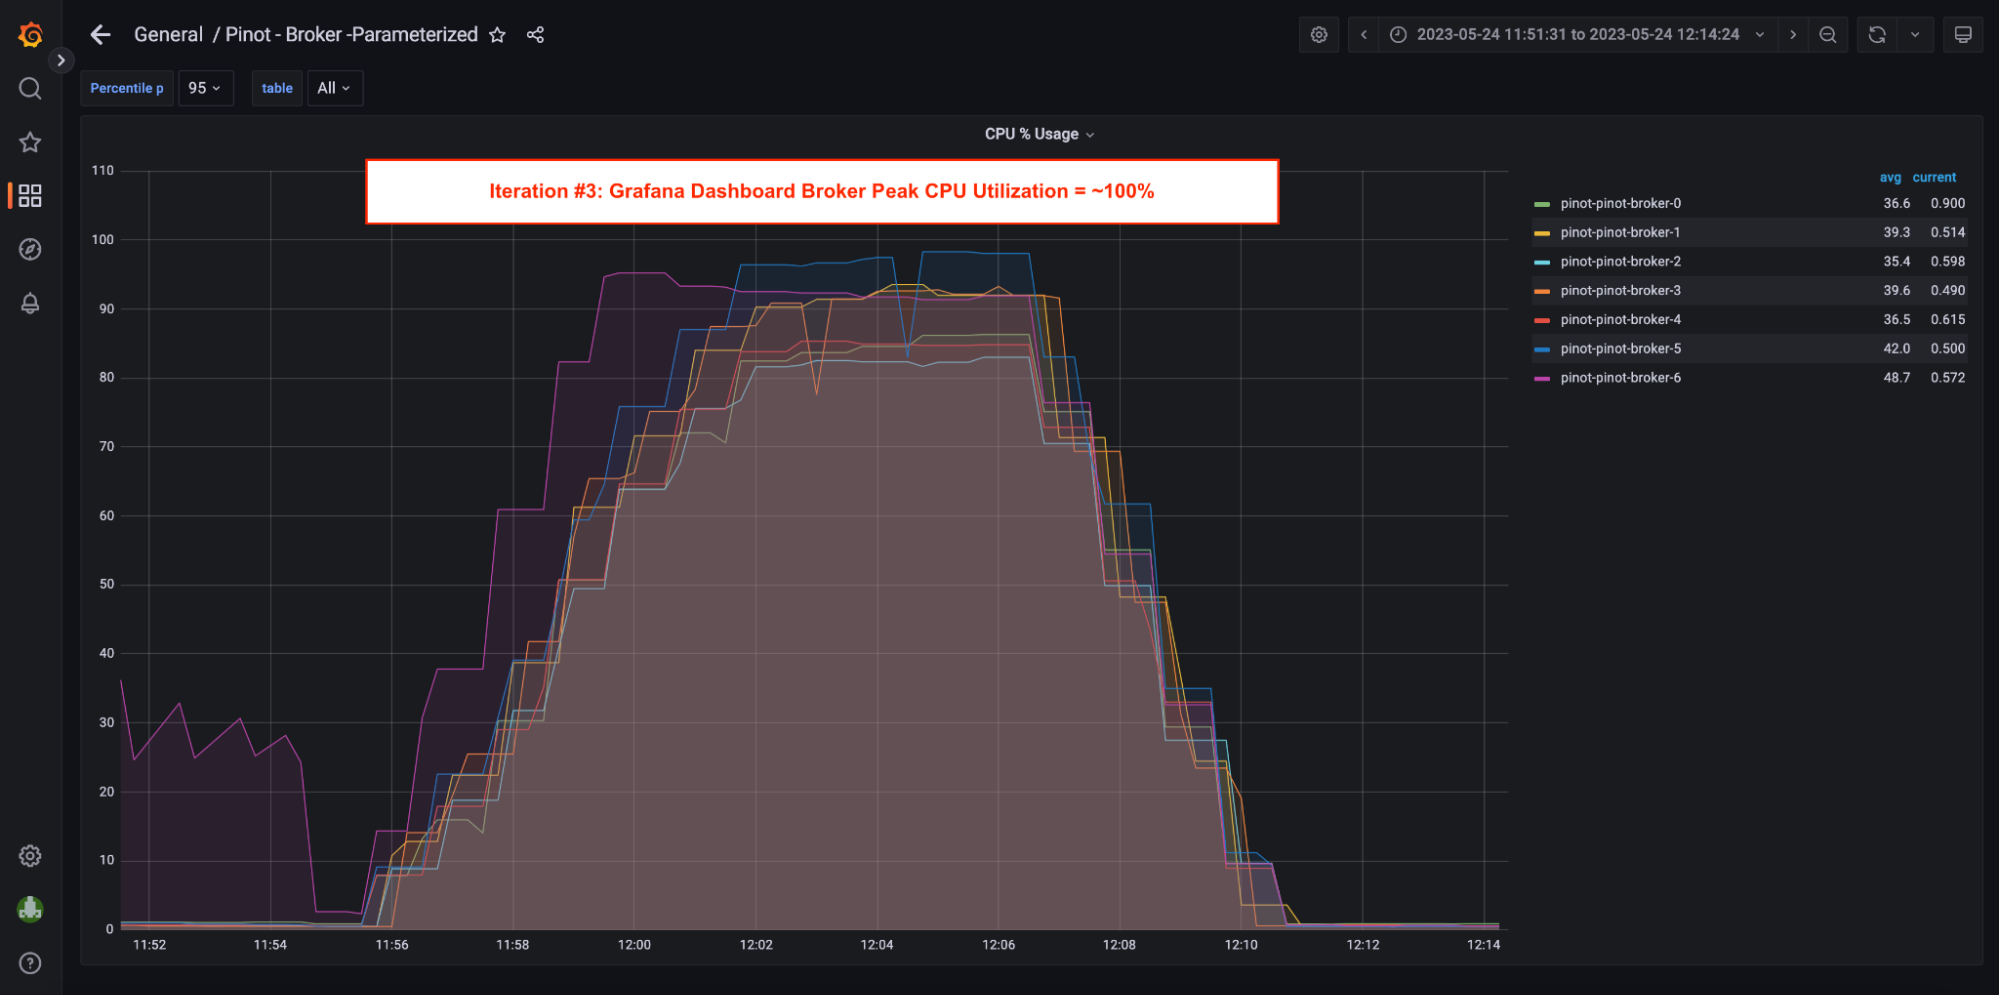
4. Broker Utilization = ~100%; Broker capacity was fully utilized in this iteration with peak CPU closer to 100% mark. Brokers did not have capacity to take in more QPS.
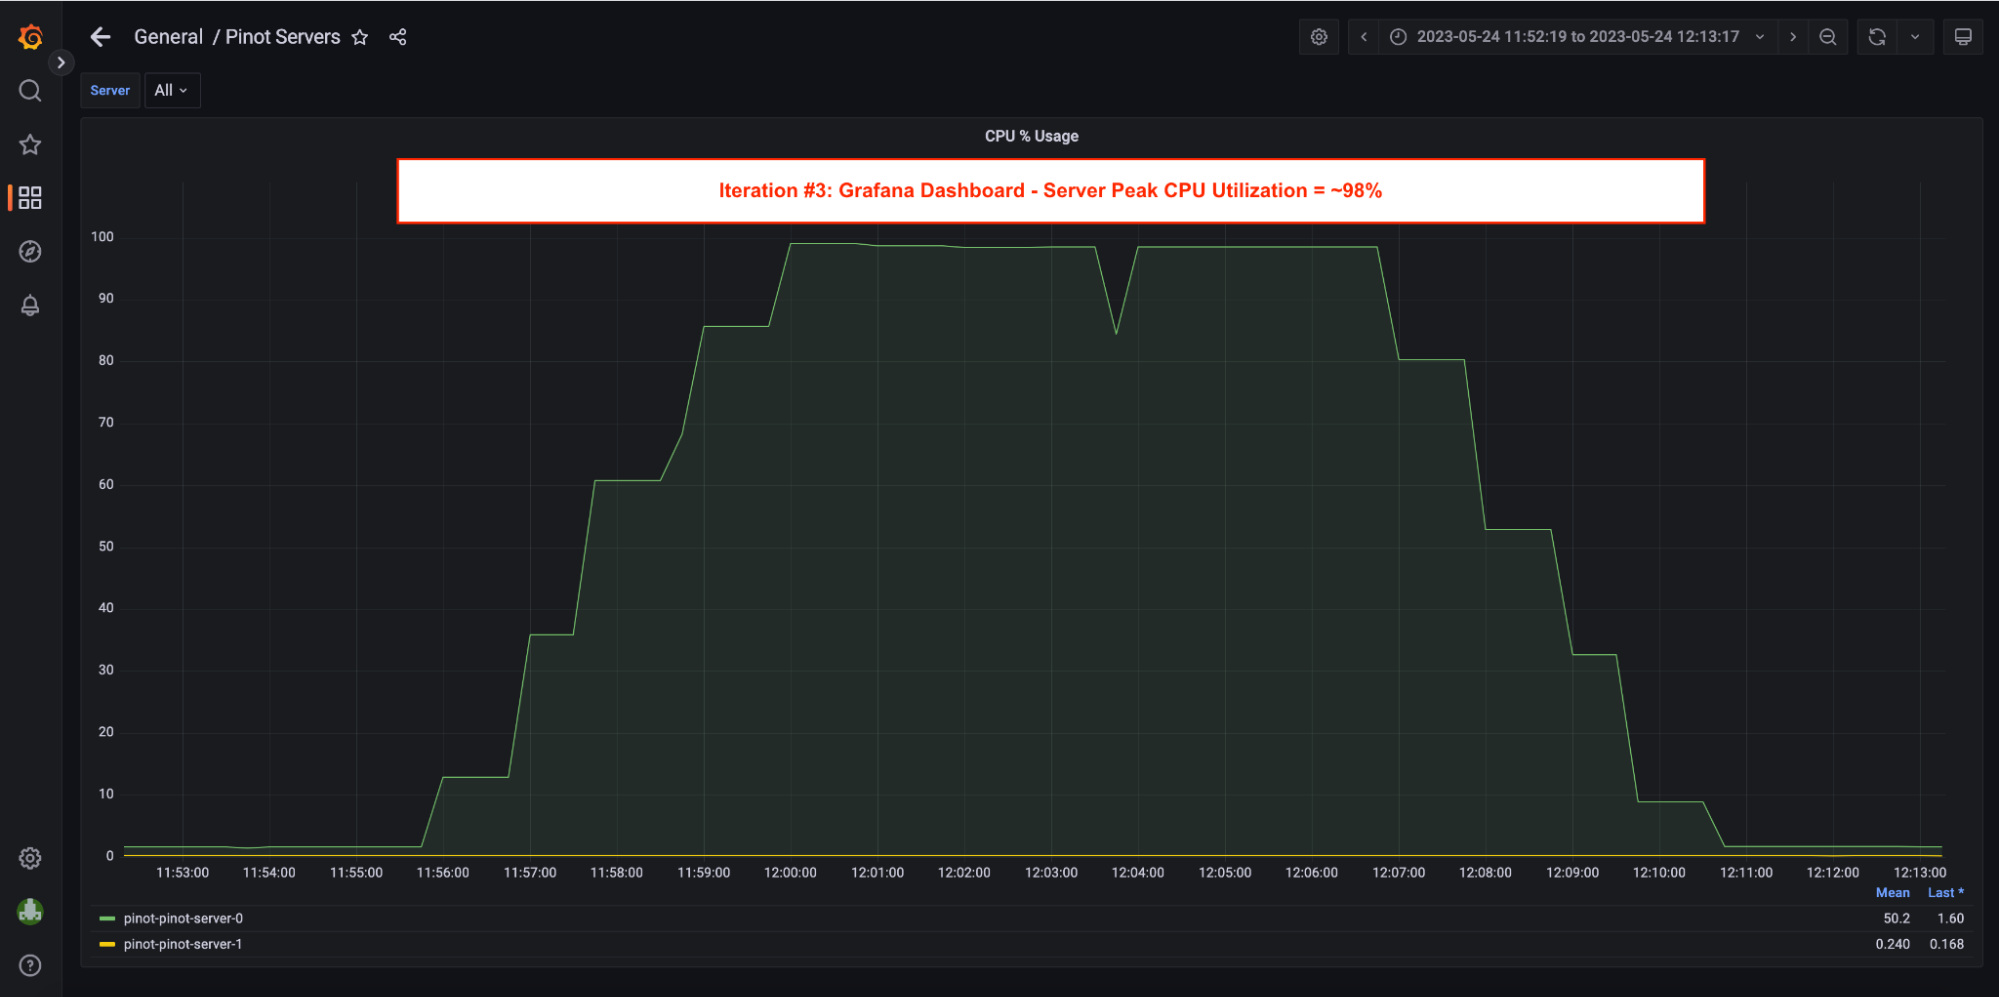
5. Server Utilization = ~98%; Pinot Server CPU utilization peaked at ~98% in this iteration.
=> Neither Broker nor servers had the capacity to take more workload. We were finally able to extract the most juice out of this ONE 4 vCPU Pinot Server.
Star-Tree Index Impact Summary:
1. 100% Reliability – No failed / timed out queries were observed.
2. ~95% drop in p90th , p95th and p99th Latencies .
3. 126 x increase in Throughput .
- 3,494 QPS with a tiny 4 vCPU Pinot Server is a phenomenal performance and a great testimony to what the star-tree index brings to the table.
- Note: Peak Server Utilization was at ~20%, which means the server could easily take additional load (in theory, 5x more load).
Closing Remarks:
Disk IO is the most expensive operation in query processing. The star-tree index reduces the Disk IO significantly. Instead of scanning raw documents from the disk and computing aggregates on the fly, star-tree index scans pre-aggregated documents for the combination of dimensions specified in the query from the disk.
In part 1 of the series, we saw that the star-tree index reduced the disc reads by 99.999% from 584 Million entries (in case of an inverted index) to 2,045 . Query latency came down from 1,513 ms to 4 ms! This in itself was a HUGE benefit.
In addition, the memory and CPU usage decreased significantly, freeing up resources for taking up more concurrent workloads. The cumulative effect was the 126 x increase in QPS on this small 4 vCPU Pinot Server as we saw in this blog.
In part 3 of this series, we will cover a few real production use cases and examples that benefited by using star-tree Index.
Intrigued by What You’ve Read?
If your interest has been piqued by what you’ve read, the next step is to load your own data into an open source Apache Pinot cluster, or, if you prefer a fully-managed database-as-a-service (DBaaS) sign up today for a StarTree Cloud account, free for 30 days. If you have more questions, make sure to sign up for the StarTree Community Slack.