
The Apache Pinot community recently released version 0.12.0, which has lots of goodies for you to play with. I’ve been exploring and writing about those features in a series of blog posts.
This post will explore a new API endpoint that lets you check how much Pinot is lagging when ingesting from Apache Kafka.
Why do we need this?
A common question in the Pinot community is how to work out the consumption status of real-time tables.
This was a tricky one to answer, but Pinot 0.12 sees the addition of a new API that lets us see exactly what’s going on.
Worked Example
Let’s have a look at how it works with help from a worked example.
First, we’re going to create a Kafka topic with 5 partitions:
docker exec -it kafka-lag-blog kafka-topics.sh --bootstrap-server localhost:9092 --partitions 5 --topic events --create Code language: CSS (css)We’re going to populate this topic with data from a data generator, which is shown below:
import datetime, uuid, random, json, click, time @click.command() @click.option('--sleep', default=0.0, help='Sleep between each message') def generate(sleep): while True: ts = datetime.datetime.now().strftime("%Y-%m-%dT%H:%M:%S.%fZ") id = str(uuid.uuid4()) count = random.randint(0, 1000) print(json.dumps({"tsString": ts, "uuid": id, "count": count})) time.sleep(sleep) if __name__ == '__main__': generate()Code language: PHP (php)We can see an example of the messages generated by this script by running the following:
python datagen.py –sleep 0.01 2>/dev/null | head -n3 | jq -c
You should see something like this:
{"tsString":"2023-03-17T12:10:03.854680Z","uuid":"f3b7b5d3-b352-4cfb-a5e3-527f2c663143","count":690} {"tsString":"2023-03-17T12:10:03.864815Z","uuid":"eac57622-4b58-4456-bb38-96d1ef5a1ed5","count":522} {"tsString":"2023-03-17T12:10:03.875723Z","uuid":"65926a80-208a-408b-90d0-36cf74c8923a","count":154}Code language: JSON / JSON with Comments (json)So far, so good. Let’s now ingest this data into Kafka:
python datagen.py --sleep 0.01 2>/dev/null | jq -cr --arg sep ø '[.uuid, tostring] | join($sep)' | kcat -P -b localhost:9092 -t events -KøCode language: JavaScript (javascript)Next we’re going to create a Pinot schema and table. First, the schema config:
{ "schemaName": "events", "dimensionFieldSpecs": [{"name": "uuid", "dataType": "STRING"}], "metricFieldSpecs": [{"name": "count", "dataType": "INT"}], "dateTimeFieldSpecs": [ { "name": "ts", "dataType": "TIMESTAMP", "format": "1:MILLISECONDS:EPOCH", "granularity": "1:MILLISECONDS" } ] }Code language: JSON / JSON with Comments (json)And now, the table config:
{ "tableName": "events", "tableType": "REALTIME", "segmentsConfig": { "timeColumnName": "ts", "schemaName": "events", "replication": "1", "replicasPerPartition": "1" }, "tableIndexConfig": { "loadMode": "MMAP", "streamConfigs": { "streamType": "kafka", "stream.kafka.topic.name": "events", "stream.kafka.broker.list": "kafka-lag-blog:9093", "stream.kafka.consumer.type": "lowlevel", "stream.kafka.consumer.prop.auto.offset.reset": "smallest", "stream.kafka.consumer.factory.class.name": "org.apache.pinot.plugin.stream.kafka20.KafkaConsumerFactory", "stream.kafka.decoder.class.name": "org.apache.pinot.plugin.stream.kafka.KafkaJSONMessageDecoder", "realtime.segment.flush.threshold.rows": "10000000" } }, "ingestionConfig": { "transformConfigs": [ { "columnName": "ts", "transformFunction": "FromDateTime(tsString, 'YYYY-MM-dd''T''HH:mm:ss.SSSSSS''Z''')" } ] }, "tenants": {}, "metadata": {} }Code language: JSON / JSON with Comments (json)We can create both the table and schema using the AddTable command:
docker run --network lag_blog -v $PWD/config:/config apachepinot/pinot:0.12.0-arm64 AddTable -schemaFile /config/schema.json -tableConfigFile /config/table.json -controllerHost "pinot-controller-lag-blog" -execCode language: JavaScript (javascript)Now let’s call the /consumingSegmentsInfo endpoint to see what’s going on:
curl “http://localhost:9000/tables/events/consumingSegmentsInfo” 2>/dev/null | jq
The output of calling this end point is shown below:
{ "_segmentToConsumingInfoMap": { "events__0__0__20230317T1133Z": [ { "serverName": "Server_172.29.0.4_8098", "consumerState": "CONSUMING", "lastConsumedTimestamp": 1679052823350, "partitionToOffsetMap": { "0": "969" }, "partitionOffsetInfo": { "currentOffsetsMap": { "0": "969" }, "latestUpstreamOffsetMap": { "0": "969" }, "recordsLagMap": { "0": "0" }, "availabilityLagMsMap": { "0": "26" } } } ], … }Code language: JavaScript (javascript)If we look under partitionOffsetInfo, we can see what’s going on:
- currentOffsetsMap is Pinot’s current offset
- latestUpstreamOffsetMap is Kafka’s offset
- recordsLagMap is the record lag
- availabilityLagMsMap is the time lag
This output is a bit unwieldy, so let’s create a bash function to tidy up the output into something that’s easier to consume:
function consuming_info() { curl "http://localhost:9000/tables/events/consumingSegmentsInfo" 2>/dev/null | jq -rc '[._segmentToConsumingInfoMap | keys[] as $k | (.[$k] | .[] | { segment: $k, kafka: (.partitionOffsetInfo.currentOffsetsMap | keys[] as $k | (.[$k])), pinot: (.partitionOffsetInfo.latestUpstreamOffsetMap | keys[] as $k | (.[$k])), recordLag: (.partitionOffsetInfo.recordsLagMap | keys[] as $k | (.[$k])), timeLagMs: (.partitionOffsetInfo.availabilityLagMsMap | keys[] as $k | (.[$k])) })] | (.[0] |keys_unsorted | @tsv), (.[] |map(.) |@tsv)' | column -t printf "n" }Code language: JavaScript (javascript)Let’s call the function:
consuming_info
We’ll see the following output:
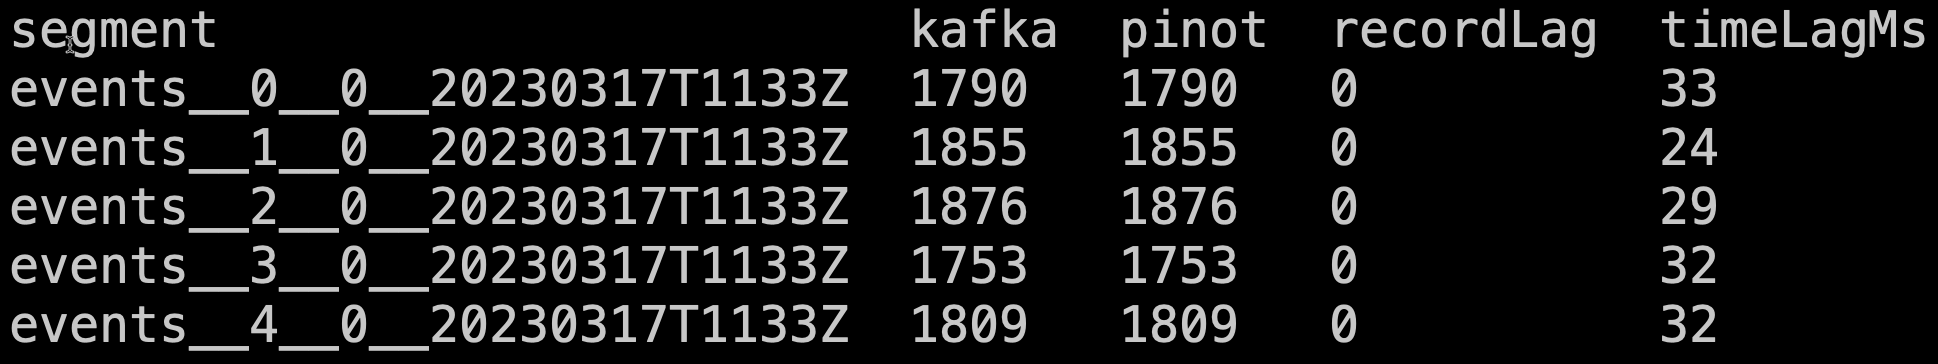
Now let’s put it in a script and call the watch command so that it will be refreshed every couple of seconds:
!#/bin/bash function consuming_info() { curl "http://localhost:9000/tables/events/consumingSegmentsInfo" 2>/dev/null | jq -rc '[._segmentToConsumingInfoMap | keys[] as $k | (.[$k] | .[] | { segment: $k, kafka: (.partitionOffsetInfo.currentOffsetsMap | keys[] as $k | (.[$k])), pinot: (.partitionOffsetInfo.latestUpstreamOffsetMap | keys[] as $k | (.[$k])), recordLag: (.partitionOffsetInfo.recordsLagMap | keys[] as $k | (.[$k])), timeLagMs: (.partitionOffsetInfo.availabilityLagMsMap | keys[] as $k | (.[$k])) })] | (.[0] |keys_unsorted | @tsv), (.[] |map(.) |@tsv)' | column -t printf "n" } export -f consuming_info watch bash -c consuming_info Code language: PHP (php)Give permissions to run it as a script:
chmod u+x watch_consuming_info.sh
And finally, run it:
./watch_consuming_info.sh
This will print out a new table every two seconds. Let’s now make things more interesting by removing the sleep from our ingestion command:
python datagen.py 2>/dev/null | jq -cr --arg sep ø '[.uuid, tostring] | join($sep)' | kcat -P -b localhost:9092 -t events -KøCode language: JavaScript (javascript)And now if we look at the watch output:
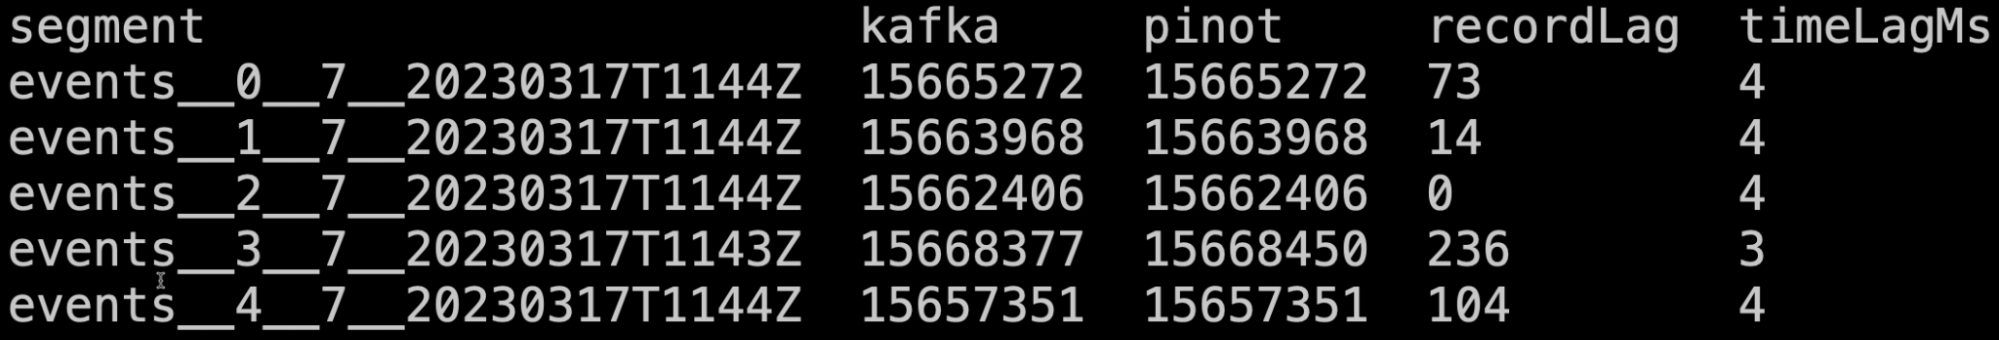
We get some transitory lag, but it generally goes away by the next time the command is run.
Summary
I love this feature, and it solves a problem I’ve struggled with when using my datasets. I hope you’ll find it just as useful.
Give it a try, and let us know how you get on. If you have any questions about this feature, feel free to join us on Slack, where we’ll be happy to help you out.