Three decades ago, I remember writing reports using Crystal Reports. Boy, did I think I was smart! I could write a report, and release it, with minimal coding and get so much appreciation and so many brownie points for just getting the ability to analyze business data to a business user.
One of the challenges with this tool and approach was that I was collecting “raw” data. Back then, storage was expensive. The idea of having two data stores—one for OLTP and one for OLAP was unheard of in my circles.
OLTP: Online transaction Processing involves creating data structures to support faster transactional applications.
OLAP: Online Analytical Processing involves creating data structures to facilitate multi-dimensional analytical queries faster.
In another job, supporting applications that handled credit card transactions, my team was contractually bound to keep the transaction processing time under a second. There is no way I could write a Crystal Report against this data. The solution was to have two copies of the data. There was the OLTP data or the “primary” copy, and there was the “secondary” copy, where we ran all our reports.
Much better!
However, the data structure was not optimized for OLAP. So, we created a “query optimized” version of the data. At this time, storage was still a bit expensive, and now we wanted a star schema—we had FACT and DIM tables.
A Star Schema divided data into a central FACT table that stored immutable data, such as a person or a description of a product name, while transaction data was stored in Dimension or DIM tables. These often reflected business transactions like a purchase or a shipment.
Much, much better!
In 2003 Amazon launched its cloud services, followed by S3 storage in 2006, and suddenly, storage became cheap. This is when we start to see the evolution of Data Lakes.
A Data Lake is a repository of data in its raw format. The data in a Data Lake is unaltered and unoptimized transactional data.
So here we are: Business Intelligence is a thing, based on Analytics as an evolved discipline, and data is Big now!
Who needs “fresh” data?
I remember being stuck in a cold, clinical-looking hotel room in Seattle while visiting Microsoft for a conference somewhere around 2018-2019. I did not feel like going out in the wet and cold to explore my food options, so I decided to order food via Uber Eats. The cool thing about this experience was that I could see the delivery times. Now, this was “fresh” data. Five minutes make a lot of difference in this case. I could feel the “hangry” coming on, so I ordered. The criteria were: food I could eat (vegan), food that looked delicious (Asian), and food that had the lowest delivery time. And I was going to give the restaurant a bad review if the delivery was late! The delivery time had better be correct.
The reality is that we use fresh data all the time in our day-to-day experience today and don’t even notice it!
While working for a new startup targeting golfers funded by AOL back in the 90s, I contacted NOAA to see if I could get their weather prediction data. The idea was to provide weather data to golfers so they could plan their tee time. The person on the other end was intrigued and just gave me access to an FTP site. I set up a system that downloaded the files every hour, parsed the content, and generated weather predictions for golfers to plan their day based on their location.
AOL was a popular American web service provider that was big in the nineties.
NOAA is the National Oceanic and Atmospheric Administration in the USA.
Of course, the frequency of this data being relevant was low: golfers checking will it rain that day compared to my food delivery schedule today. The Uber Eats data is much “fresher” than the weather system I created back then. There are a few more factors here, though:
- On any given day, a golfer might check the weather on our website once. Thankfully, there were not many concurrent queries.
- Most of our customers were US based.
So, we served weather data, but not too much of it, and it didn’t need to be all that up-to-date.
Compare that to Uber Eats customers today. There are a lot of restaurants, a lot of people, and lots of deliveries. This means the application will hit the database with many concurrent queries because there are many “hangry” people on Uber Eats. So we have lots of data, and it’s being checked by many, many people. Also, the freshness of data matters. While I was checking the delivery times, each restaurant was receiving new orders, which impacted delivery times. So Uber Eats needed to receive new data and recalculate the approximate delivery times in real time.
Real-time data is information that is delivered and processed immediately after collection.
What is Apache Pinot™?
Pinot is a real-time distributed OLAP datastore, purpose-built to provide ultra low-latency analytics, even at extremely high throughput. To provide this, we need three things:
- Fast ingestion for the “real” in the real-time data. This ensures that query results will always reflect very fresh data.
- Fast queries at scale. People always place high expectations on the responsiveness of a UI, user-facing queries require low latency.
- The ability to handle many queries at once. We should expect to see many more simultaneous queries than a traditional internal-facing dashboard.

Let’s talk about ingestion.
Apache Pinot supports both Batch and Stream ingestion of data.
Imagine all the restaurants that need to be added to the Uber Eats platform. Also, from time to time, we want to ingest all the restaurant reviews, menus, and other data that does not change frequently onto the Pinot platform. This would be the batch data. To make matters more interesting, the data being ingested is complex. Each restaurant has a name, location, cuisine, menu, etc.
Then, there are all the orders coming in, order changes, delivery status, and so on. This is the “transactional” data that needs to be streamed to our Pinot system—and the orders keep coming in large volumes. In other words, all the streaming data is being processed at scale.
The batch process is intermittent—it operates periodically based on predetermined time intervals or on demand.
The streaming process is continuous—it responds to events as they happen.
High Dimension in statistics refers to the ratio of observations vs features. For example, we might examine ten persons in a doctor’s office (these are our observations), but for each patient, we might gather 50 individual observations, like height, weight, blood pressure, heart rate, Hemoglobin A1C level, etc.
To create any analytical platform that is considered real-time, we have to ingest those observations as they occur and make them available for querying immediately after we ingest them.
Now, let’s talk about queries and latency.
In the case of my Uber Eats order, I need to know how quickly my food will be delivered. The challenge, though, is that I am not the only “hangry” person refreshing my screen every two seconds. Apache Pinot supports hundreds of thousands of queries per second in order to provide the scaled real-time experience. And the queries can take an average of single-digit milliseconds to execute. Pinot queries have incredible execution latency, even in the face of a highly concurrent workload.
That, my friends, is Apache Pinot.
How does it work?
Back when I was working for a company that created payroll software in the early 2000s, I found that calculating payroll was a very slow process. One of the reasons for this was that about fifty percent of the data stored in the database of this very conventional relational database was the tax table. Reading or writing to this table made life difficult for anyone running any queries against the database. The second reason was that the payroll calculations were done on the desktop of the payroll clerk. I know, I know. These were the shrink wrap software days.
To make matters worse, they wanted to create a SaaS version of the product with all the data for many, many companies in one monolithic database, sharing CPUs, memory, disk, and everything.
Modern database systems are distributed for a reason. They don’t expect any single server to be able to do all the work of the entire database. Rather, they come up with ways of distributing both the storage of the data and the computation required to process queries among many smaller servers. This ends up being a lower latency and provides a higher concurrency compared to using a single bigger and better server. Let’s look at Storage.

One of the secret sauces of Apache Pinot is the way the data is stored. It needs to be written or consumed fast so that it can be queried quickly, and it needs to be organized in a way that the query results are fast.
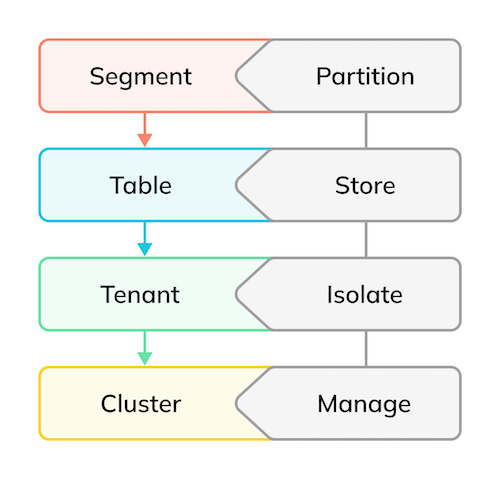
Apache Pinot supports the concept of a table just like any other SQL database. Each table, however, isn’t stored all in one place, but instead is divided into segments that can be stored on separate machines. This process is automatic and completely invisible to the user, unlike explicit sharding or partitioning schemes used by other databases.
Sharding or partitioning is the process of splitting up a database/table across multiple machines to improve an application’s manageability, performance, availability, and load balancing.
Additionally, support for multi-tenancy is included out of the box.
Multi-tenancy allows multiple users, or “tenants,” to access the same storage and computing resources of a shared environment while ensuring that each tenant’s data remains isolated and invisible to the others.
Logically, a cluster is simply a group of tenants. A cluster, explained in more detail in the upcoming section, is the combination of one or more of the Apache Pinot components, namely Zookeeper, Controller, Broker and Server.
The Components
Now that we see some of the parts, let’s see how they operate together.
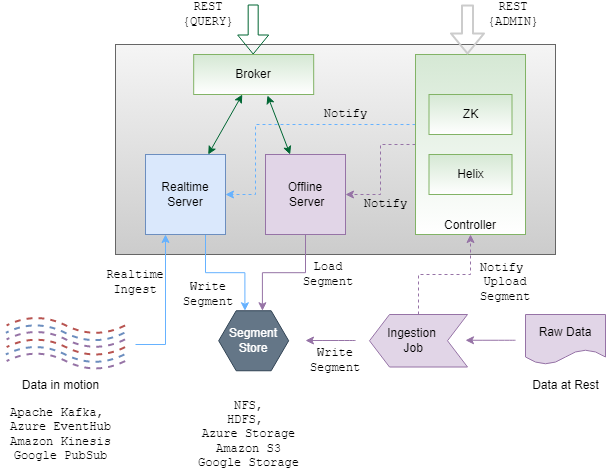
Zookeeper: This service acts as a distributed file system and tracks the current state and configuration for the Apache Pinot cluster.
Controller: This service controls the cluster health and performance. Using Zookeeper, it provides end points for the REST APIs, segment uploads, and all supporting tools, including the Data Manager (optional) and the Data Explorer. It also is responsible for batch ingestion of data. Under the hoods, it uses Apache Helix for the actual configuration management.
Broker: Brokers handle query execution and act as routers for queries against the servers containing table and segment data. Brokers track location of data and collate the results from disparate servers.
Server: Each server manages their segments. Servers come in two flavors: offline and online. The online servers are responsible for consuming streams or data as well as performing queries from appropriate segments. They do all the reading, writing, indexing, etc.

Image source: docs.apache.pinot.org
Apache ZooKeeper is a centralized service for maintaining configuration information, naming, providing distributed synchronization, and providing group services.
Apache Helix is a cluster management framework used for the automatic management of partitioned, replicated, and distributed resources hosted on a cluster of nodes.
Conclusion
As you see, Apache Pinot is widely used to solve the challenge of real-time analytics at scale in the modern data rich world. It remains open source and is evolving fast. In the next article in the series, I will walk you through a step-by-step installation of Apache Pinot locally. Feel free to reach out to me if you have any questions, and DO join our community slack channel https://stree.ai/slack if you want to learn more, have questions, or desire to connect with the community.
