The recent Apache Pinot™ 0.11.0 release has lots of goodies for you to play with. This is the third in a series of blog posts showing off some of the new features in this release.
Pinot introduced the TIMESTAMP data type in the 0.8 release, which stores the time in millisecond epoch long format internally. The community feedback has been that the queries they’re running against timestamp columns don’t need this low-level granularity.
Instead, users write queries that use the datetrunc function to filter at a coarser grain of functionality. Unfortunately, this approach results in scanning data and time value conversion work that takes a long time at large data volumes.
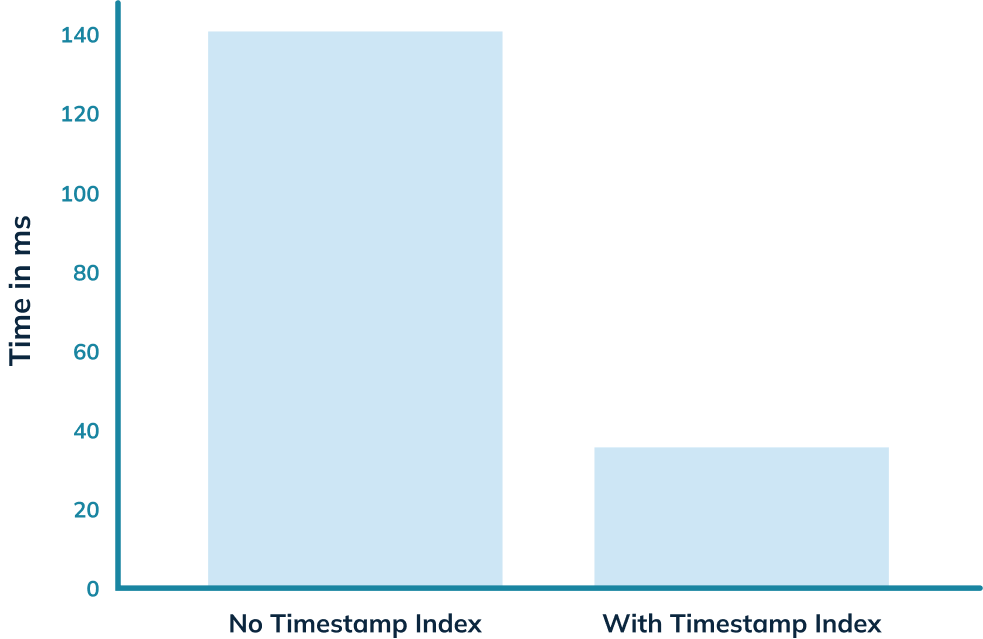
The timestamp index solves that problem! In this blog post, we’ll use it to get an almost 5x query speed improvement on a relatively small dataset of only 7m rows.

Spinning up Pinot
We’re going to be using the Pinot Docker container, but first, we’re going to create a network, as we’ll need that later on:
docker network create timestamp_blog
We’re going to spin up the empty QuickStart in a container named pinot-timestamp-blog:
docker run
    -p 8000:8000
    -p 9000:9000
    --name pinot-timestamp-blog
    --network timestamp_blog
    apachepinot/pinot:0.11.0
    QuickStart -type EMPTYCode language: PHP (php)
Or if you’re on a Mac M1, change the name of the image to have the arm-64 suffix, like this:
<span class="">docker run
    </span>  -p 8000:8000
      -p 9000:9000
        --network timestamp_blog
     --name pinot-timestamp-blog
      apachepinot/pinot:0.11.0-arm64
      QuickStart -type EMPTYCode language: HTML, XML (xml)
Once that’s up and running, we’ll be able to access the Pinot Data Explorer at http://localhost:9000, but at the moment, we don’t have any data to play with.
Importing Chicago Crime Dataset
The Chicago Crime dataset is a small to medium-sized dataset with 7 million records representing reported crimes in the City of Chicago from 2001 until today.
It contains details of the type of crime, where it was committed, whether an arrest was recorded, which beat it occurred on, and more.
Each of the crimes has an associated timestamp, which makes it a good dataset to demonstrate timestamp indexes.
You can find the code used in this blog post in the Analyzing Chicago Crimes recipe section of Pinot Recipes GitHub repository. From here on, I’m assuming that you’ve downloaded this repository and are in the recipes/analyzing-chicago-crimes directory.
We’re going to create a schema and table named crimes by running the following command:
<span class="">docker run
    </span>   --network timestamp_blog
       -v $PWD/config:/config
       apachepinot/pinot:0.11.0-arm64 AddTable
         -schemaFile /config/schema.json
         -tableConfigFile /config/table.json
         -controllerHost pinot-timestamp-blog
        -execCode language: HTML, XML (xml)
We should see the following output:
2022/11/03 13:07:57.169 INFO [AddTableCommand] [main] {"unrecognizedProperties":{},"status":"TableConfigs crimes successfully added"}
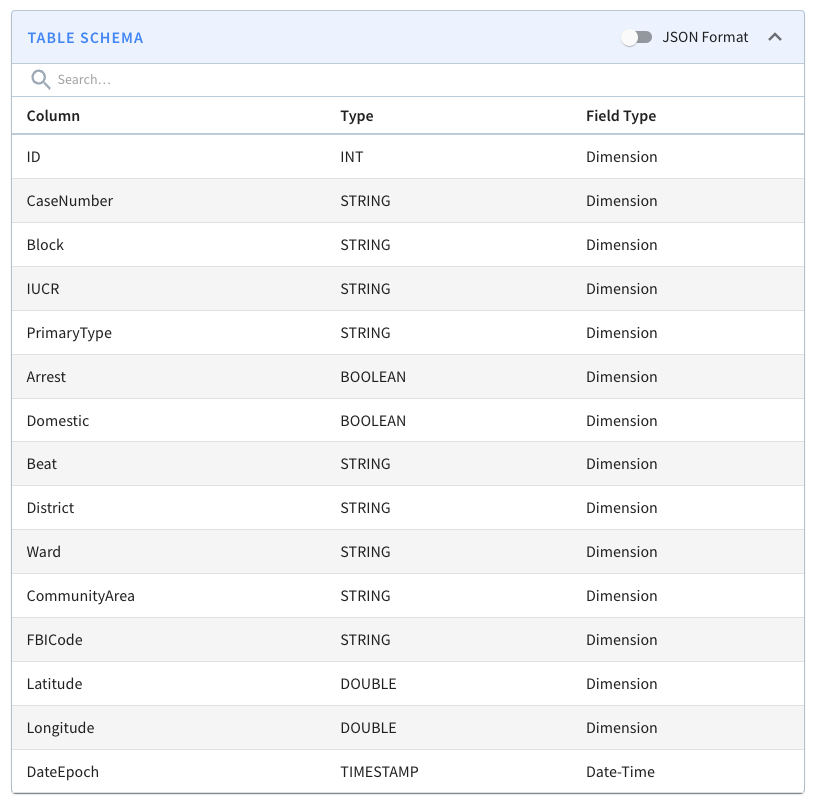
A screenshot of the schema is shown below:

We won’t go through the table config and schema files in this blog post because we did that in the last post, but you can find them in the config directory on GitHub.
Now, let’s import the dataset.
<span class="">docker run
    </span>   --network timestamp_blog
       -v $PWD/config:/config
       -v $PWD/data:/data
       apachepinot/pinot:0.11.0-arm64 LaunchDataIngestionJob
        -jobSpecFile /config/job-spec.yml
         -values controllerHost=pinot-timestamp-blogCode language: HTML, XML (xml)
It will take a few minutes to load, but once that command has finished, we’re ready to query the crimes table.
Querying crimes by date
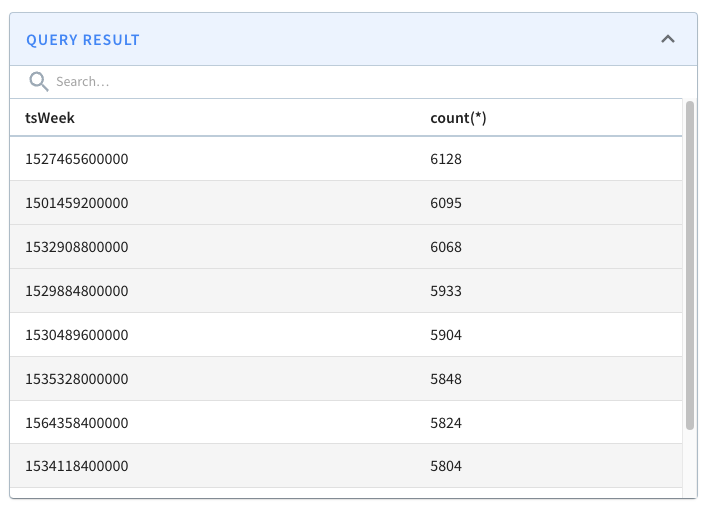
The following query finds the number of crimes that happened after 16th January 2017, grouped by week of the year, with the most crime-filled weeks shown first:
<span class="">select datetrunc('WEEK', DateEpoch) as tsWeek, count(*)
    </span>from crimes
    WHERE tsWeek > fromDateTime('2017-01-16', 'yyyy-MM-dd')
    group by tsWeek
    order by count(*) DESC
    limit 10Code language: HTML, XML (xml)
If we run that query, we’ll see the following results:

And, if we look above the query result, there’s metadata about the query, including the time that it took to run.

The query took 141 ms to execute, so that’s our baseline.
Adding the timestamp index
We could add a timestamp index directly to this table and then compare query performance, but to make it easier to do comparisons, we’re going to create an identical table with the timestamp index applied.
The full table config is available in the config/table-index.json file, and the main change is that we’ve added the following section to add a timestamp index on the DateEpoch column:
<span class="">"fieldConfigList": [
    </span>  {
        "name": "DateEpoch",
        "encodingType": "DICTIONARY",
        "indexTypes": ["TIMESTAMP"],
        "timestampConfig": {
          "granularities": [
            "DAY",
            "WEEK",
            "MONTH"
          ]
        }
      }
    ],Code language: HTML, XML (xml)
encodingType will always be ‘DICTIONARY’ and indexTypes must contain ‘TIMESTAMP’. We should specify granularities based on our query patterns.
As a rule of thumb, work out which values you most commonly pass as the first argument to the datetrunc function in your queries and include those values.
The full list of valid granularities is: millisecond , second , minute , hour , day , week , month , quarter , and year .
Our new table is called crimes_indexed, and we’re also going to create a new schema with all the same columns called crimes_indexed, as Pinot requires the table and schema names to match.
We can create the schema and table by running the following command:
<span class="">docker run
    </span>   --network timestamp_blog
       -v $PWD/config:/config
       apachepinot/pinot:0.11.0-arm64 AddTable
         -schemaFile /config/schema-index.json
         -tableConfigFile /config/table-index.json
         -controllerHost pinot-timestamp-blog
        -execCode language: HTML, XML (xml)
We’ll populate that table by copying the segment that we created earlier for the crimes table.
<span class="">docker run
    </span>   --network timestamp_blog
       -v $PWD/config:/config
       -v $PWD/data:/data
       apachepinot/pinot:0.11.0-arm64 LaunchDataIngestionJob
        -jobSpecFile /config/job-spec-download.yml
         -values controllerHost=pinot-timestamp-blogCode language: HTML, XML (xml)
If you’re curious how that job spec works, I wrote a blog post explaining it in a bit more detail.
Once the Pinot Server has downloaded this segment, it will apply the timestamp index to the DateEpoch column.
For the curious, we can see this happening in the log files by connecting to the Pinot container and running the following grep command:
<span class="">docker exec -iti pinot-timestamp-blog
</span> grep -rni -A10 "Successfully downloaded segment:.*crimes_indexed_OFFLINE.*"
logs/pinot-all.logCode language: HTML, XML (xml)We’ll see something like the following (tidied up for brevity):
<span class="">[BaseTableDataManager]  Successfully downloaded segment: crimes_OFFLINE_0 of table: crimes_indexed_OFFLINE to index dir: /tmp/1667490598253/quickstart/PinotServerDataDir0/crimes_indexed_OFFLINE/crimes_OFFLINE_0
    </span>[V3DefaultColumnHandler]  Starting default column action: ADD_DATE_TIME on column: $DateEpoch$DAY
    [SegmentDictionaryCreator]  Created dictionary for LONG column: $DateEpoch$DAY with cardinality: 7969, range: 978307200000 to 1666742400000
    [V3DefaultColumnHandler]  Starting default column action: ADD_DATE_TIME on column: $DateEpoch$WEEK
    [SegmentDictionaryCreator]  Created dictionary for LONG column: $DateEpoch$WEEK with cardinality: 1139, range: 978307200000 to 1666569600000
    [V3DefaultColumnHandler]  Starting default column action: ADD_DATE_TIME on column: $DateEpoch$MONTH
    [SegmentDictionaryCreator]  Created dictionary for LONG column: $DateEpoch$MONTH with cardinality: 262, range: 978307200000 to 1664582400000
    [RangeIndexHandler]  Creating new range index for segment: crimes_OFFLINE_0, column: $DateEpoch$DAY
    [RangeIndexHandler]  Created range index for segment: crimes_OFFLINE_0, column: $DateEpoch$DAY
    [RangeIndexHandler]  Creating new range index for segment: crimes_OFFLINE_0, column: $DateEpoch$WEEK
    [RangeIndexHandler]  Created range index for segment: crimes_OFFLINE_0, column: $DateEpoch$WEEKCode language: HTML, XML (xml)
What does a timestamp index do?
So, the timestamp index has now been created, but what does it actually do?
When we add a timestamp index on a column, Pinot creates a derived column for each granularity and adds a range index for each new column.
In our case, that means we’ll have these extra columns: $DateEpoch$DAY, $DateEpoch$WEEK, and $DateEpoch$MONTH.
We can check if the extra columns and indexes have been added by navigating to the segment page and typing $Date$Epoch in the search box. You should see the following:

These columns will be assigned the following values:
$DateEpoch$DAY = dateTrunc(‘DAY’, DateEpoch)$DateEpoch$WEEK = dateTrunc(‘WEEK’, DateEpoch)$DateEpoch$MONTH = dateTrunc(‘MONTH’, DateEpoch)
Pinot will also rewrite any queries that use the dateTrunc function with DAY, WEEK, or MONTH and the DateEpoch field to use those new columns.
This means that this query:
<span class="">select datetrunc('WEEK', DateEpoch) as tsWeek, count(*)
    </span>from crimes_indexed
    GROUP BY tsWeek
    limit 10Code language: HTML, XML (xml)
Would be rewritten as:
<span class="">select  $DateEpoch$WEEK as tsWeek, count(*)
    </span>from crimes_indexed
    GROUP BY tsWeek
    limit 10Code language: HTML, XML (xml)
And our query:
<span class="">select datetrunc('WEEK', DateEpoch) as tsWeek, count(*)
    </span>from crimes
    WHERE tsWeek > fromDateTime('2017-01-16', 'yyyy-MM-dd')
    group by tsWeek
    order by count(*) DESC
    limit 10Code language: HTML, XML (xml)
Would be rewritten as:
<span class="">select $DateEpoch$WEEK as tsWeek, count(*)
    </span>from crimes
    WHERE tsWeek > fromDateTime('2017-01-16', 'yyyy-MM-dd')
    group by tsWeek
    order by count(*) DESC
    limit 10Code language: HTML, XML (xml)
Re-running the query
Let’s now run our initial query against the crimes_indexed table. We’ll get exactly the same results as before, but let’s take a look at the query stats:

This time the query takes 36 milliseconds rather than 140 milliseconds. That’s an almost 5x improvement, thanks to the timestamp index.
Summary
Hopefully, you’ll agree that timestamp indexes are pretty cool, and achieving a 5x query improvement without much work is always welcome!
If you’re using timestamps in your Pinot tables, be sure to try out this index and let us know how it goes on the StarTree Community Slack. We’re always happy to help out with any questions or problems you encounter.

