Apache Pinot
In this blog post, we’re going to analyze the Chicago Crimes dataset with Apache Pinot. We’ll learn how to build a table and schema, write an ingestion job to get the data into Pinot, and finally build a Streamlit app to explore the data.
All the code used in this post is available in the StarTree pinot-recipes/analyzing-chicago-crimes GitHub repository if you want to follow along at home.
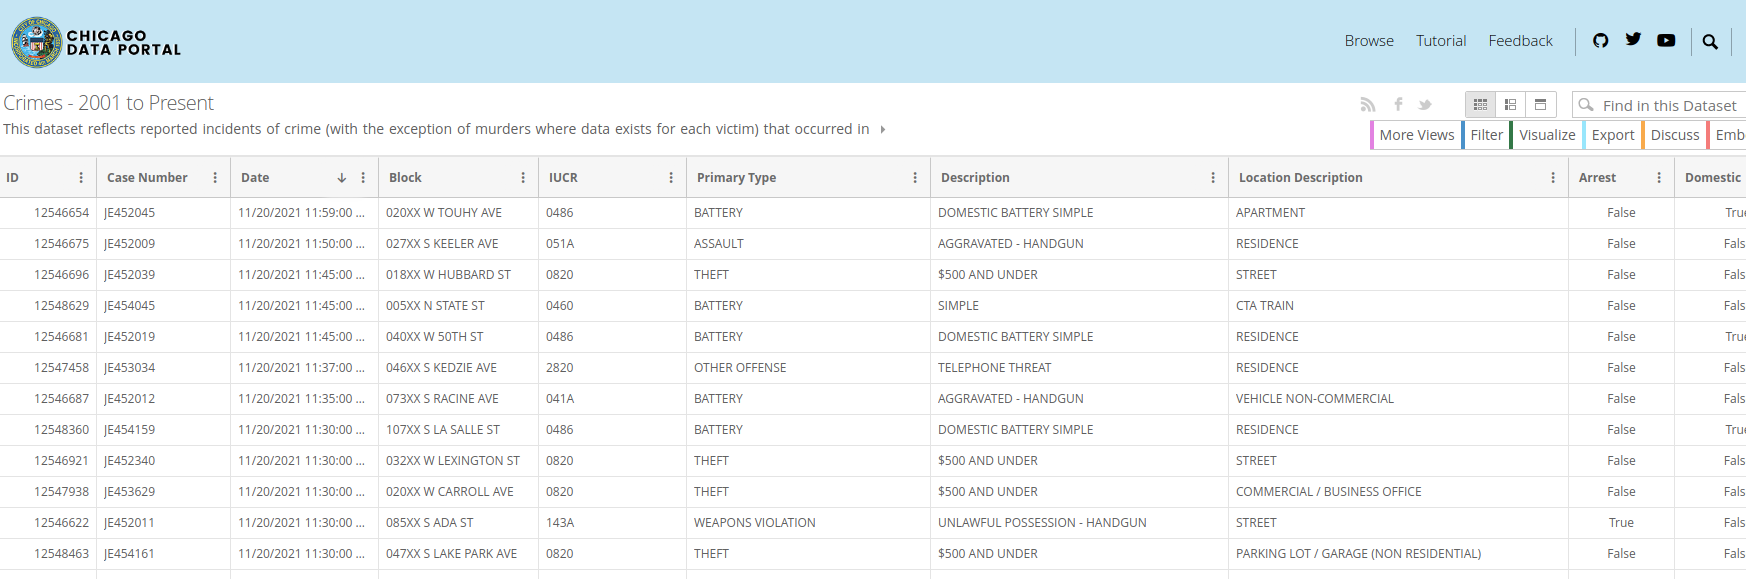
The Chicago Crimes dataset is an open dataset from the Chicago Data Portal that contains reported incidents of crime that occurred in the City of Chicago from 2001 until today. It contains details of the type of crime, where it was committed, whether an arrest was recorded, which beat it occurred on, and more. At the time of writing, there are just over 7 million records in this dataset.
A screenshot of the data is shown below:
When I first started playing around with Pinot about 6 months ago, I asked (my now colleague) Neha Pawar how I would know whether a dataset was a good fit for Pinot. Neha suggested the following rules of thumb:
Data coming from real time streams of events, such as Wikipedia, GitHub, Meetup, or more. This is the use case for the majority of Pinot users.
Data sets where the query patterns are of an analytical nature e.g. slicing and dicing on any columns.
The Chicago Crime dataset is static, but it has a lot of different columns that we can filter and aggregate against, so it should be a fun one to explore.
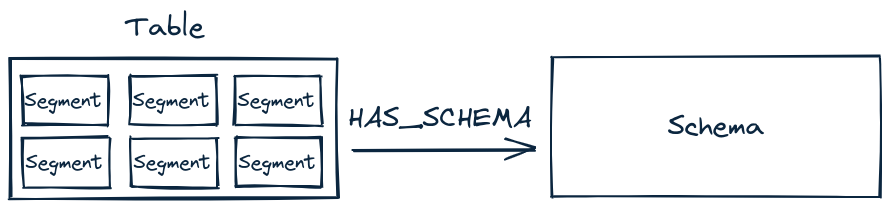
Since all the data is in a CSV file, we will import it into an offline table using a batch ingestion job. Data is stored in segments (think partitions in a relational database) and a table is made up of many segments. Each table is associated with a schema and we could use the same schema for multiple tables if we so wanted. The diagram below shows how these components are related to each other:
Now we need to define a schema. A schema defines the fields in our table and their data types. We also need to decide which category each field will belong to. There are three categories:
Dimension – These columns are used in slice and dice operations (e.g. GROUP BY or WHERE clauses)
Metric – These columns represent quantitative data and would usually be used in aggregations (e.g. SUM, MIN, MAX, COUNT)
DateTime – These columns represent date or time data.
The Chicago Crimes dataset doesn’t have any columns that contain quantitative data, so the majority of our columns are going to be Dimensions. The Date field is an exception, it will have the DateTime category.
When ingesting data, Pinot assumes that the schema column names match the names of fields in the data source. This means that most of the time we don’t have to write any mapping logic. In this case, however, our CSV file has fields that contain spaces in their name. Schema column names can’t contain spaces, so we’ll need to create a column name without a space and then write an ingestion transformation function in the table config to map the data across.
We’re going to use the following schema:
{
"schemaName": "crimes",
"dimensionFieldSpecs": [
{
"name": "ID",
"dataType": "INT"
},
{
"name": "CaseNumber",
"dataType": "STRING"
},
{
"name": "Block",
"dataType": "STRING"
},
{
"name": "IUCR",
"dataType": "STRING"
},
{
"name": "PrimaryType",
"dataType": "STRING"
},
{
"name": "Arrest",
"dataType": "BOOLEAN"
},
{
"name": "Domestic",
"dataType": "BOOLEAN"
},
{
"name": "Beat",
"dataType": "STRING"
},
{
"name": "District",
"dataType": "STRING"
},
{
"name": "Ward",
"dataType": "STRING"
},
{
"name": "CommunityArea",
"dataType": "STRING"
},
{
"name": "FBICode",
"dataType": "STRING"
},
{
"name": "Latitude",
"dataType": "DOUBLE"
},
{
"name": "Longitude",
"dataType": "DOUBLE"
}
],
"dateTimeFieldSpecs": [
{
"name": "DateEpoch",
"dataType": "TIMESTAMP",
"format" : "1:MILLISECONDS:EPOCH",
"granularity": "1:MILLISECONDS"
}
]
}
CopyFor the columns with spaces, we’ve created a column name that doesn’t have those spaces in the schema. We’re not going to store the Date in its current format, instead, we’ll write a transformation function to convert it into an epoch. We’ll handle column name mapping and date parsing in the table config in the next section.
Next, we’ll define our table config, as shown below:
{
"tableName": "crimes",
"tableType": "OFFLINE",
"segmentsConfig": {
"replication": 1,
"schemaName": "crimes"
},
"tenants": {
"broker":"DefaultTenant",
"server":"DefaultTenant"
},
"tableIndexConfig": {
"loadMode": "MMAP",
"sortedColumn": ["Beat"],
"rangeIndexVersion": 2,
"rangeIndexColumns": ["DateEpoch"]
},
"ingestionConfig": {
"batchIngestionConfig": {
"segmentIngestionType": "APPEND",
"segmentIngestionFrequency": "DAILY"
},
"transformConfigs": [
{"columnName": "CaseNumber", "transformFunction": "\"Case Number\"" },
{"columnName": "PrimaryType", "transformFunction": "\"Primary Type\"" },
{"columnName": "CommunityArea", "transformFunction": "\"Community Area\"" },
{"columnName": "FBICode", "transformFunction": "\"FBI Code\"" },
{"columnName": "DateEpoch", "transformFunction": "FromDateTime(\"Date\", 'MM/dd/yyyy hh:mm:ss a')" }
]
},
"metadata": {}
}
CopyOur table config specifies the table name, associated schema name (defaults to the table name if not specified), ingestion transformation functions, and indexes. We can also apply indexes after the table has been created if we later decide that we need more indexes.
An exception to this is that a Pinot table can only have a sorted index on one column and when doing offline data ingestion we need to make sure that our data is sorted by this column otherwise the index won’t work. We’d usually choose a field that we want to filter against regularly and that has a high cardinality.
In this case, I can see we want to learn what types of crimes are happening on each beat. A beat is defined as “the smallest police geographic area – each beat has a dedicated police beat car”. Chicago has 304 beats, which isn’t all that many, but this field has a reasonably high cardinality compared to the others. We’ll need to make sure that we sort the CSV file by the Beat column before we ingest it into Pinot.
We’ve also defined a range index on the DateEpoch field so that we can quickly find out what crimes happened in a time window.
As mentioned earlier, schema column names can’t have spaces, so we have to create column names without spaces and write transformation functions to get the data into those columns. We’ve also written a function for the Data column to convert its DateTime strings to timestamps so that we can run range queries against that column.
Now that we’ve got the schema and table defined it’s time to get the data into Pinot. The table ingestion spec is defined below:
executionFrameworkSpec:
name: 'standalone'
segmentGenerationJobRunnerClassName: 'org.apache.pinot.plugin.ingestion.batch.standalone.SegmentGenerationJobRunner'
segmentTarPushJobRunnerClassName: 'org.apache.pinot.plugin.ingestion.batch.standalone.SegmentTarPushJobRunner'
jobType: SegmentCreationAndTarPush
inputDirURI: '/data'
includeFileNamePattern: 'glob:**/Crimes_beat_sorted.csv'
outputDirURI: '/opt/pinot/data/crimes'
pinotFSSpecs:
- scheme: file
className: org.apache.pinot.spi.filesystem.LocalPinotFS
recordReaderSpec:
dataFormat: 'csv'
className: 'org.apache.pinot.plugin.inputformat.csv.CSVRecordReader'
configClassName: 'org.apache.pinot.plugin.inputformat.csv.CSVRecordReaderConfig'
tableSpec:
tableName: 'crimes'
pinotClusterSpecs:
- controllerURI: 'http://localhost:9000'
CopyWe can then execute this spec and it will create a single segment containing all the data. That segment will form part of the crimes table, which we’ll query in the next section.
The data is now loaded, so it’s time to write some queries.
We’ll start by checking on which beat the most crimes were reported, which we can do by running the following query:
SELECT Beat, count(*)
FROM crimes
GROUP BY Beat
ORDER BY count(*) DESC
LIMIT 10
CopyBeats 0421 and 0423 have both had more than 57,000 crimes reported, although these are spread over 20 years, which gives us just over 3,000 reported crimes per beat per year. Let’s narrow the time range to see what’s been happening recently. The following query finds the types of crimes committed on one week in October 2021:
select PrimaryType, count(*)
from crimes
WHERE DateEpoch BETWEEN
FromDateTime('2021-10-01', 'yyyy-MM-dd') AND
FromDateTime('2021-10-08', 'yyyy-MM-dd')
GROUP BY PrimaryType
ORDER BY count(*) DESC
LIMIT 10
CopyWe could also narrow this down to see what was happening on that day for specific beats:
SELECT DateEpoch, Block, CaseNumber, PrimaryType
FROM crimes
WHERE DateEpoch BETWEEN
FromDateTime('2021-10-01', 'yyyy-MM-dd') AND
FromDateTime('2021-10-08', 'yyyy-MM-dd')
AND Beat IN ('0421', '0423', '0624', '0511')
ORDER BY DateEpoch
LIMIT 10
CopyRunning these queries individually gets a bit boring after a while, so let’s see we can put them all together into an app.
Streamlit is a Python based tool that makes it super easy to build data based single-page web applications. We’re going to use it with the Pinot Python client and Plotly charting library to explore Chicago crimes.
Below you can see a gif showing a little app where we can select police beats and see the types of crimes committed, when they were committed over the last 20 years, and the time of day that they were committed:
We can see that regardless of the beat selected, very few of the crimes result in an arrest. Most crimes report seem to be in the afternoon, although there are some places where they are also in the evenings. And the most commonly reported crime is theft!
We won’t go into the code in this post, but you can find it at github.com/startreedata/pinot-recipes/blob/main/recipes/analyzing-chicago-crimes/app.py.
In this post, we’ve learnt how to import a CSV file containing millions of records into Pinot, write ad-hoc queries against the subsequent table, and finally build a little app to glue our queries together with Streamlit.
We showed the query times with indexes configured, but if you want to see how they compare to an un-indexed setup, I’ve written a couple of blog posts exploring that in more detail:
We haven’t even looked into the spatial aspect of this dataset, but that will be a good starting point for the next blog post.
Apache PinotStreamlit