I’m a big runner and, like many of my fellow running enthusiasts, I record my activities on a running watch and upload them to Strava. My initial idea for a dataset was to import all the points recorded by my watch on these runs into Strava. My watch seems to record my location roughly ever 5-10 seconds, so I would have over 1 million records to play with.
The problem was that the data is static and Pinot shines when working with real-time data. I therefore came up with the idea of generating imaginary runs and importing those into Pinot instead. The only question was what route I should use for those imaginary runs.
Park Run
Enter Park Run!
Park Run is an organisation that free weekly community events, mostly in the UK, but also in some other countries around the world. 5k runs are hosted on Saturday mornings and 2k runs on Sunday mornings.
Each of the events has a course that can be download in KML format. From these KML files we can extract the lat/long coordinates that comprise the route, as well as the start and finish locations.
The diagram below shows the Wimbledon Common course:
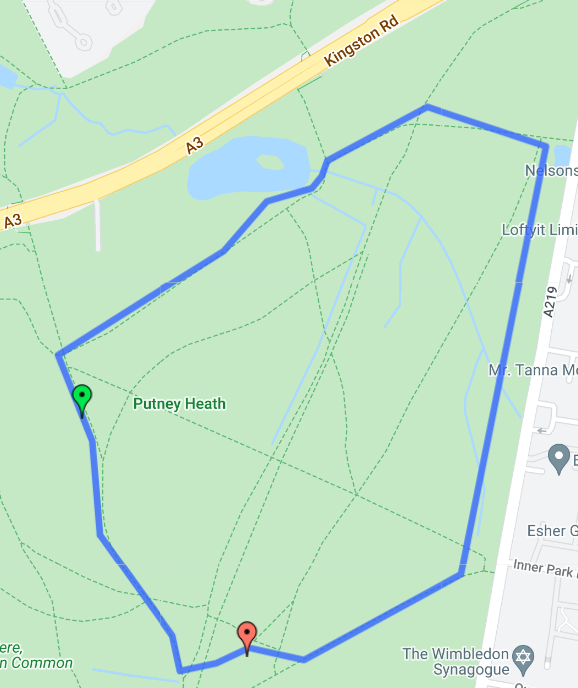
And below are the coordinates for this course:
<Placemark> <name>Wimbledon Common parkrun Course</name> <description>The Wimbledon Common parkrun (http://www.parkrun.org.uk/wimbledon-common/Home.aspx) course is just over two complete anti-clockwise laps.</description> <styleUrl>#line-3366FF-6000</styleUrl> <LineString> <tessellate>1</tessellate> <coordinates> -0.23189,51.44067,0 -0.23047,51.43944,0 -0.23033,51.43902,0 -0.22961,51.43911,0 -0.22897,51.4393,0 -0.22791,51.43915,0 -0.22483,51.44019,0 -0.22318,51.4454,0 -0.22549,51.44587,0 -0.22745,51.44522,0 -0.22756,51.44503,0 -0.22776,51.44489,0 -0.22863,51.44472,0 -0.22947,51.44413,0 -0.2327,51.44286,0 -0.23204,51.44181,0 -0.23189,51.44067,0 </coordinates> </LineString> </Placemark>Code language: HTML, XML (xml)Now that we’ve got these coordinates we can generate some imaginary runs.
Application Architecture
But before we do that, let’s have a brief look at what we’re going to build. Below is a mini architecture diagram showing how everything fits together:
The data generator will generate 1 event per second per competitor, representing where they are on the course. The slower they’re going, the more points there will be. e.g. if it takes them 1,000 seconds to complete the course we will generate 1,000 events.
Data Generator
Let’s go into a bit more detail about the data generator. The generator has the following input and output parameters:

i.e. the generator will generate points for a number of competitors, assuming a random pace per competitor that’s somewhere between the quickest and slowest pace provided.
Generated events look like this:
{ "runId": "c55d7f3e-1b32-4b3e-9b5d-6a17bcd5d807", "eventId": "f95cbdbc-77a6-4bb6-aa71-35506c273d78", "competitorId": 105369, "rawTime": 95, "timestamp": "2022-02-17 17:18:48", "lat": 51.44932535433582, "lon": -0.2922990415070072, "distance": 200.13706083413388, "course": "richmond" }Code language: JSON / JSON with Comments (json)The generator is written in Python and I used the pyproj library to work out where a competitor would be on the course at a given point in time. This is easier to understand with an example.
We start with a pair of coordinates (that we get from the KML file) and work out how many new points we need to generate, which is based on the competitor’s pace and the distance between the points. The code below shows how to do this:
from pyproj import Geod geoid = Geod(ellps="WGS84") point1 = (56.434604, 12.838070) point2 = (56.434625, 12.838106) points_to_generate = 2 # Pace in metres per second / distance between the points extra_points = geoid.npts(point1[0], point1[1], point2[0], point2[1], points_to_generate) for point in extra_points: print(point)Code language: PHP (php)This script assumes that we need to generate two points between point1 and point2 , but this value is configurable. If we run this script, we’ll see the following output:
(56.434610999999336, 12.838082000000197) (56.43461799999933, 12.838094000000197)Code language: CSS (css)We repeat this process for every pair of points for every competitor, generating number-of-competitors points per second.
Streamlit
The generator is then wrapped inside a Streamlit application so that we can generate new races from the web browser. Streamlit is a Python based web application framework that makes it super easy to create dynamic data apps. A screenshot of our data generator app is shown below:
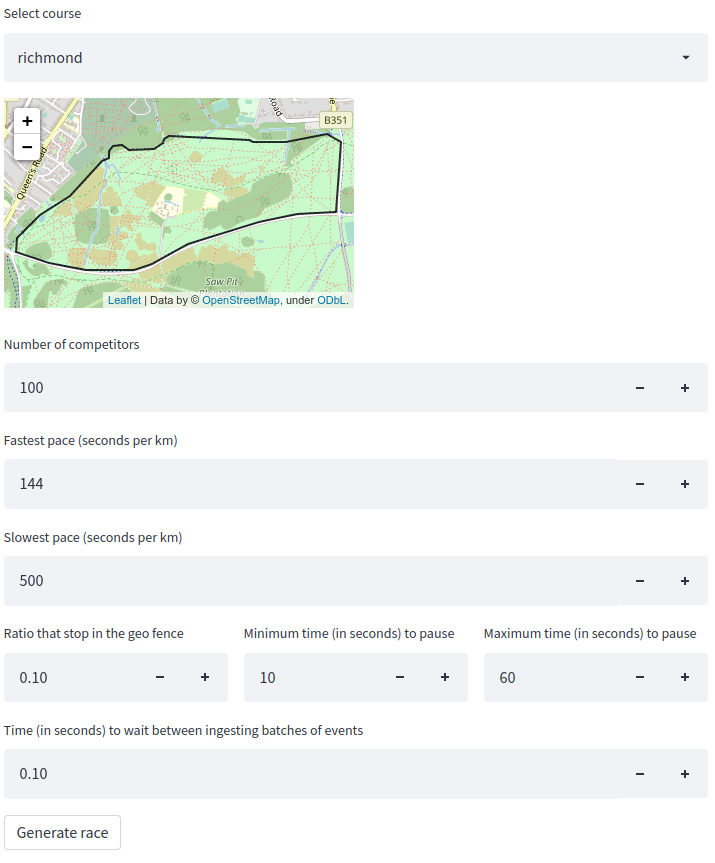
Once we press Generate Race , the events will be generated and written to a Kafka topic. We can query that topic by running the following command:
kafka-console-consumer.sh --bootstrap-server localhost:9092 --topic parkrunCode language: CSS (css)We’ll see the events streaming through, as shown below:
{"runId": "355a483c-516c-4f9f-8a31-e38fb78f0a30", "eventId": "db7b7f3e-3df9-4194-b97e-fd360119f3cb", "competitorId": 188646, "rawTime": 281, "timestamp": "2022-02-23 17:06:27", "lat": 51.45198687792672, "lon": -0.26892062526935245, "distance": 1891.2783938674356, "course": "richmond"} {"runId": "355a483c-516c-4f9f-8a31-e38fb78f0a30", "eventId": "f68991b3-925c-4c87-b5c7-95584ad2d6a3", "competitorId": 576251, "rawTime": 281, "timestamp": "2022-02-23 17:06:27", "lat": 51.451751433627315, "lon": -0.27222714591747765, "distance": 1659.4618335182934, "course": "richmond"} {"runId": "355a483c-516c-4f9f-8a31-e38fb78f0a30", "eventId": "01f0071d-0ebe-4385-964e-808aa75fbd84", "competitorId": 485843, "rawTime": 281, "timestamp": "2022-02-23 17:06:27", "lat": 51.451534118680094, "lon": -0.2739323536759484, "distance": 1538.4703022730064, "course": "richmond"}Code language: JSON / JSON with Comments (json)Apache Pinot
Now let’s see how Apache Pinot is used in this application.
We have two real-time tables and one offline table.
- parkrun – A real-time table that captures the locations of competitors every second.
- races – A real-time table that stores race metadata.
- courses – An offline table that stores the race courses, including geospatial objects representing the route, a geo-fenced area, and the start/finish points.
To refresh our minds, real-time tables are used for ingesting streaming data, whereas offline tables are for batch ingestion. In our case the courses table will be populated from a CSV file.
We’re going to use the following Pinot features.
Dimension Tables
The courses tables is a dimension table, which means that we can use it to achieve join like functionality via the lookup UDF. A copy of these tables is kept on every Pinot Server, so we need to make sure that they’re reasonably small in size.
For more information on lookup joins, see the blog post titled Lookup Based Join Support In Apache Pinot recipe, written by my colleague Dunith Dhanushka.
Geospatial
We’re going to use some of Pinot’s geospatial functionality as well. To recap, Pinot supports the following:
- Geospatial data types, such as point, line and polygon.
- Geospatial functions, for querying of spatial properties and relationships.
- Geospatial indexing, used for efficient processing of spatial operations
We’re going to use the LINESTRING data type to represent ther route of each course and the POLYGON data type to represent a geo-fenced area in each course. We’ll use various geospatial functions to convert data from the WKT text format to geospatial objects and to check whether a point exists within the geo-fenced polygon.
Upsert
The parkrun table will use Pinot’s native upsert functionality. Upsert means that queries will only return one row per primary key.
Our primary key will be the competitorId , which means by default we’ll only see the latest position on the course for each competitor.
Real-Time Dashboard
We’re going to use Streamlit and the Pinot Python driver to build a real-time dashboard on top of all this data. Our dashboard will show the latest position of each competitor in the race, as well as a summary of their race time and pace.
The animation below shows the competitors as they’re going through the geo-fenced part of the course:
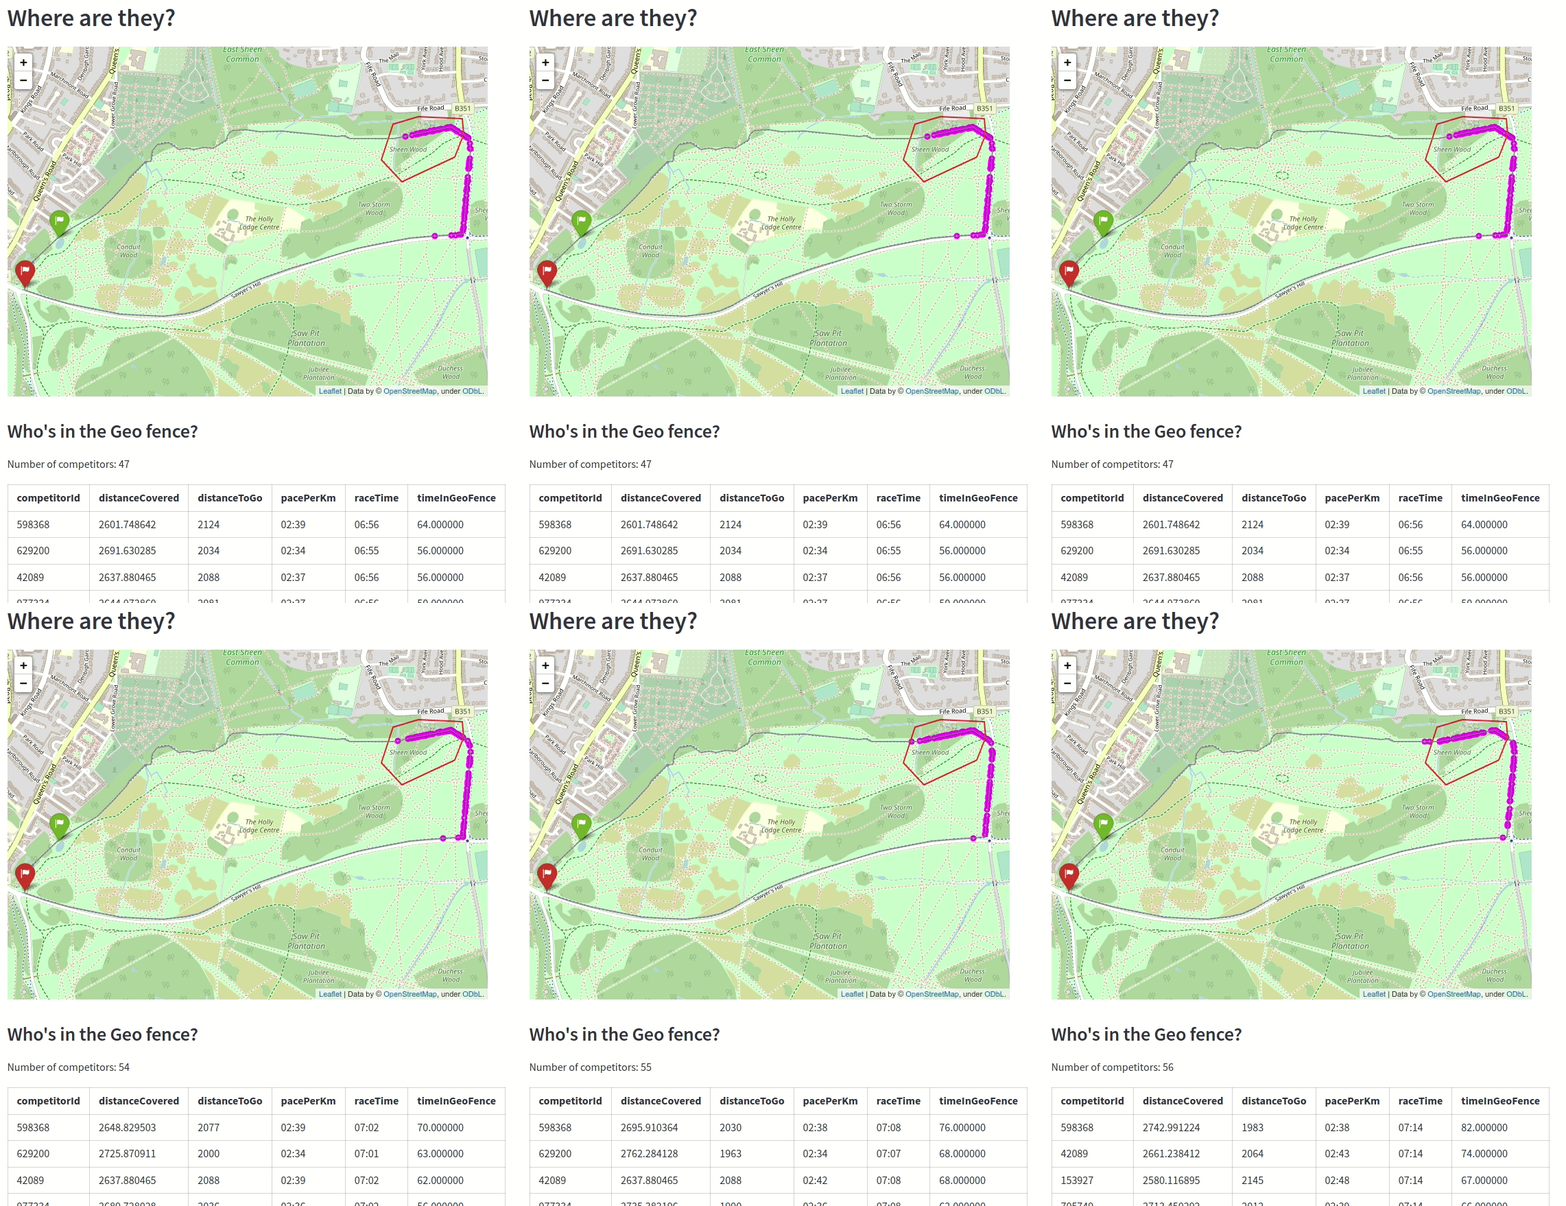
This part of the course is next to a forest, so if a person gets stuck in there for too long it might mean that they’re got stuck and need help from the race organisers!
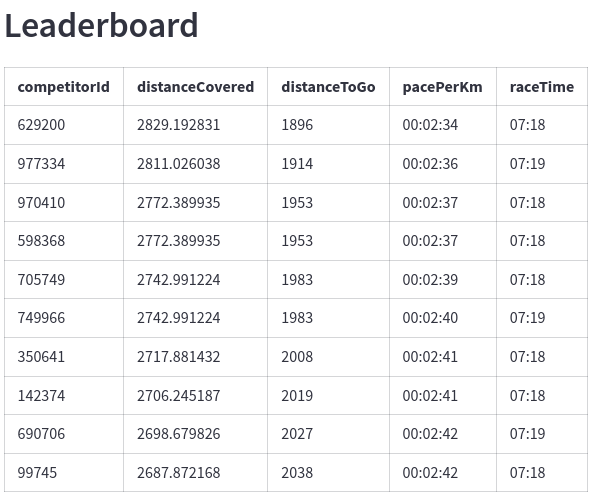
We also have a leaderboard:
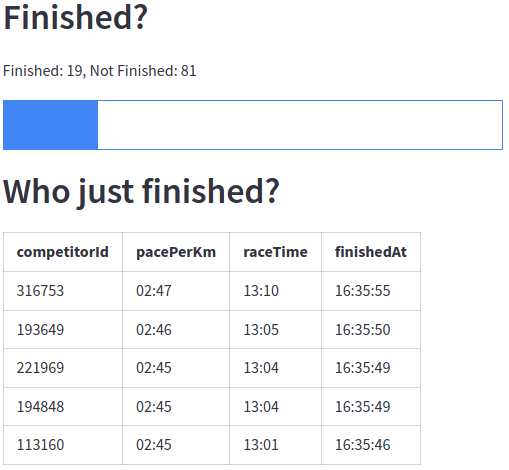
And we can also see how many people have finished the race and who finished most recently:
Summary
In this blog post we’ve learnt how to build a run simulator that demonstrates some of Apache Pinot’s features, including it’s geospatial, upsert, and join functionality. We’ve then built a real-time dashboard on top of Pinot using Streamlit and the Pinot Python driver.
The cool thing about this application is that we can see exactly what’s happening in a race, and if something goes wrong for one of the competitors, the race director would know straight away.
If you want to try out the run simulator, you can find it in the github.com/mneedham/run-simulator-pinot GitHub repository.

