A shocking 97 percent of data remains unused by organizations, according to Gartner. This shows that although every business collects data, most fall short of knowing how to make the most use of it. Perhaps the volume of data available feels almost too overwhelming to analyze, so we let it sit on the shelf. Either way, the truth is that most of us can better utilize the data we collect to improve our business, user experience, and internal systems. Even if you’re a bit constrained when cutting and slicing your data, at the very least, you need the ability to detect anomalies and monitor when an event seems out of order. A real-time anomaly detection system such as StarTree ThirdEye would equip you that way and unlock many other unique capabilities at a caliber unmatched by any other platform on the market. But first, before we get into it…
What Is Anomaly Detection?
Anomaly refers to anything out of the norm. Let’s say you write an app and publish it in an app store. The first person who downloads it proves an anomaly, but once more people download it, it becomes the norm. After a while, the app gets popular, and downloads increase (this is obviously an aspirational scenario ). That rise in downloads would constitute an anomaly unless downloads increase steadily, defining the new norm. The potential for shifting baselines in a dynamic industry makes detecting anomalies quite the challenge.
Anomaly detection works by analyzing the behavior of users in an environment over a period of time and constructing a baseline of legitimate activity. Once we establish the baseline, we’d consider any activity outside the normal parameters as anomalous and, therefore, suspicious.
Anomaly Detection Examples
Let’s take a look at a few scenarios to understand what anomaly detection looks like, more practically speaking.
Imagine that you own a small business and maintain an inventory of widgets. You only keep a limited inventory on hand because it costs money to buy and store inventory. Buying less will result in running out of stock and loss of sales, but buying too much could end up in overstocking, increased cost of storage, or spoiling. You need to stay on top of your inventory levels. When inventory gets low, you need to order more widgets. So, you just need to set a threshold that will let you know when inventory starts running low.
The Threshold Template in ThirdEye is the simplest method and detects an anomaly if a metric is above a maximum or below a minimum threshold.
Let’s say that you’re now selling 100 widgets per week regularly, and you order 400 widgets/month to handle sales for one month. If you sell 90 widgets one week, then 110 the next, you’re still good on inventory. However, if you start selling 120 widgets week after week, you need to increase your buy order for next month. In that case, you might want to look at mean-variance. The mean-variance rule in ThirdEye estimates the standard deviation and identifies its only cause as noise.
A note on noise in data: In the above example, we saw that the average sale may be one hundred, but if you sell 90 one week and 100 the next, the average still remains the same. If you start raising alarms every time that you sell 99 or 101 units a week, the alerts will overwhelm your experience and become useless. However, you can factor in some noise or deviation from the norm using the appropriate statistical approach.
What if one week goes by where you don’t make any sales? Maybe your website went down, something broke in the system, or there’s a strike. In any case, you would want to know immediately. While most models will detect this, using the absolute change or percentage change rule gives you explainability – or a better understanding of your business. If your sales drop by 50 percent or increase by 50 percent, or any other metric falls to zero, you would want to know.
Percentage rule in ThirdEye compares current data to a baseline. If the percentage change is above a certain threshold, it’s an anomaly.
Absolute change rule in ThirdEye compares current data to a baseline. If the absolute change is above a certain threshold, it’s an anomaly.
When we zoom out of the daily, weekly, and monthly scenarios, sales patterns get more complicated. For instance, sales tend to increase in the fall due to the holiday season. Hence, we need to order more widgets between November and December.
Although the average weekly sale for your widget might remain 100 for most of the year, in November and early December, that could change to 200, for example, so there is a seasonality to this data. In statistics, we use something called exponential smoothing for these use cases. To make it effective, though, we need 2-3 years of data. Exponential smoothing methods are weighted averages of past observations, with the weights decaying exponentially as the observations get older. In other words, the more recent the observation, the higher the associated weight. This framework generates reliable forecasts quickly and for a wide range of time series, which is a great advantage and of major importance to applications in the industry.
Exponential smoothing is a rule-of-thumb technique for smoothing time series data using the exponential window function. Whereas in the simple moving average, the past observations are weighted equally, exponential functions are used to assign exponentially decreasing weights over time.
In financial applications, a simple moving average (SMA) is the unweighted mean of the previous data points.
Time Series Data In mathematics, a time series is a series of data points listed in time order.
In signal processing and statistics, a window function is a mathematical function that is zero-valued outside of some chosen interval. E.g., is it the holiday season or not?
StarTree-ETS compares the current value to the value predicted by combining a regression model and an ETS forecasting algorithm.
Detection
Now that we know what anomalies are let’s focus on how to find them by looking at a typical anomaly detection scenario.
We will need to first identify and collect all of the data to search for anomalies. We then need to establish a pattern or a baseline. Finally, we need to figure out what methodology to use for detection and a way to alert the right people when an anomaly occurs. In summary:

To expound:
Data collection usually means collecting existing data and preparing it to be analyzed. This could be as simple as accessing an existing data store or as complicated as loading data, reshaping for the particular use case, and cleaning it up to detect anomalies. In many cases, this is done in batch mode, i.e., the data is moved in chunks, say every day or every hour. Not in real-time. In the case of ThirdEye, we leverage existing real-time tables in Apache Pinot™ to analyze data. Simply provide the Pinot cluster name and the table name and add the frequency at which you want to run detection to get started.
Establishing a baseline means analyzing existing data to “learn” about normal behavior. Because ThirdEye generally operates on existing data, the establishing baseline step merely becomes part of the alert creation process and takes minutes.
Algorithm selection guidelines are easy to follow and neatly laid out as part of the alert creation process in ThirdEye, which you can learn more about using this step-by-step guide. If done outside of a platform such as ThirdEye, anomaly detection algorithms could become a lengthy process.
Detection and alert is often done in batch mode and after the fact. ThirdEye creates alerts on a real-time store such as Apache Pinot. The frequency of analysis is as low as every minute, allowing for an alert to trigger within a second of an anomaly happening. This enables you to react as soon as an anomaly occurs rather than later when it’s too late.
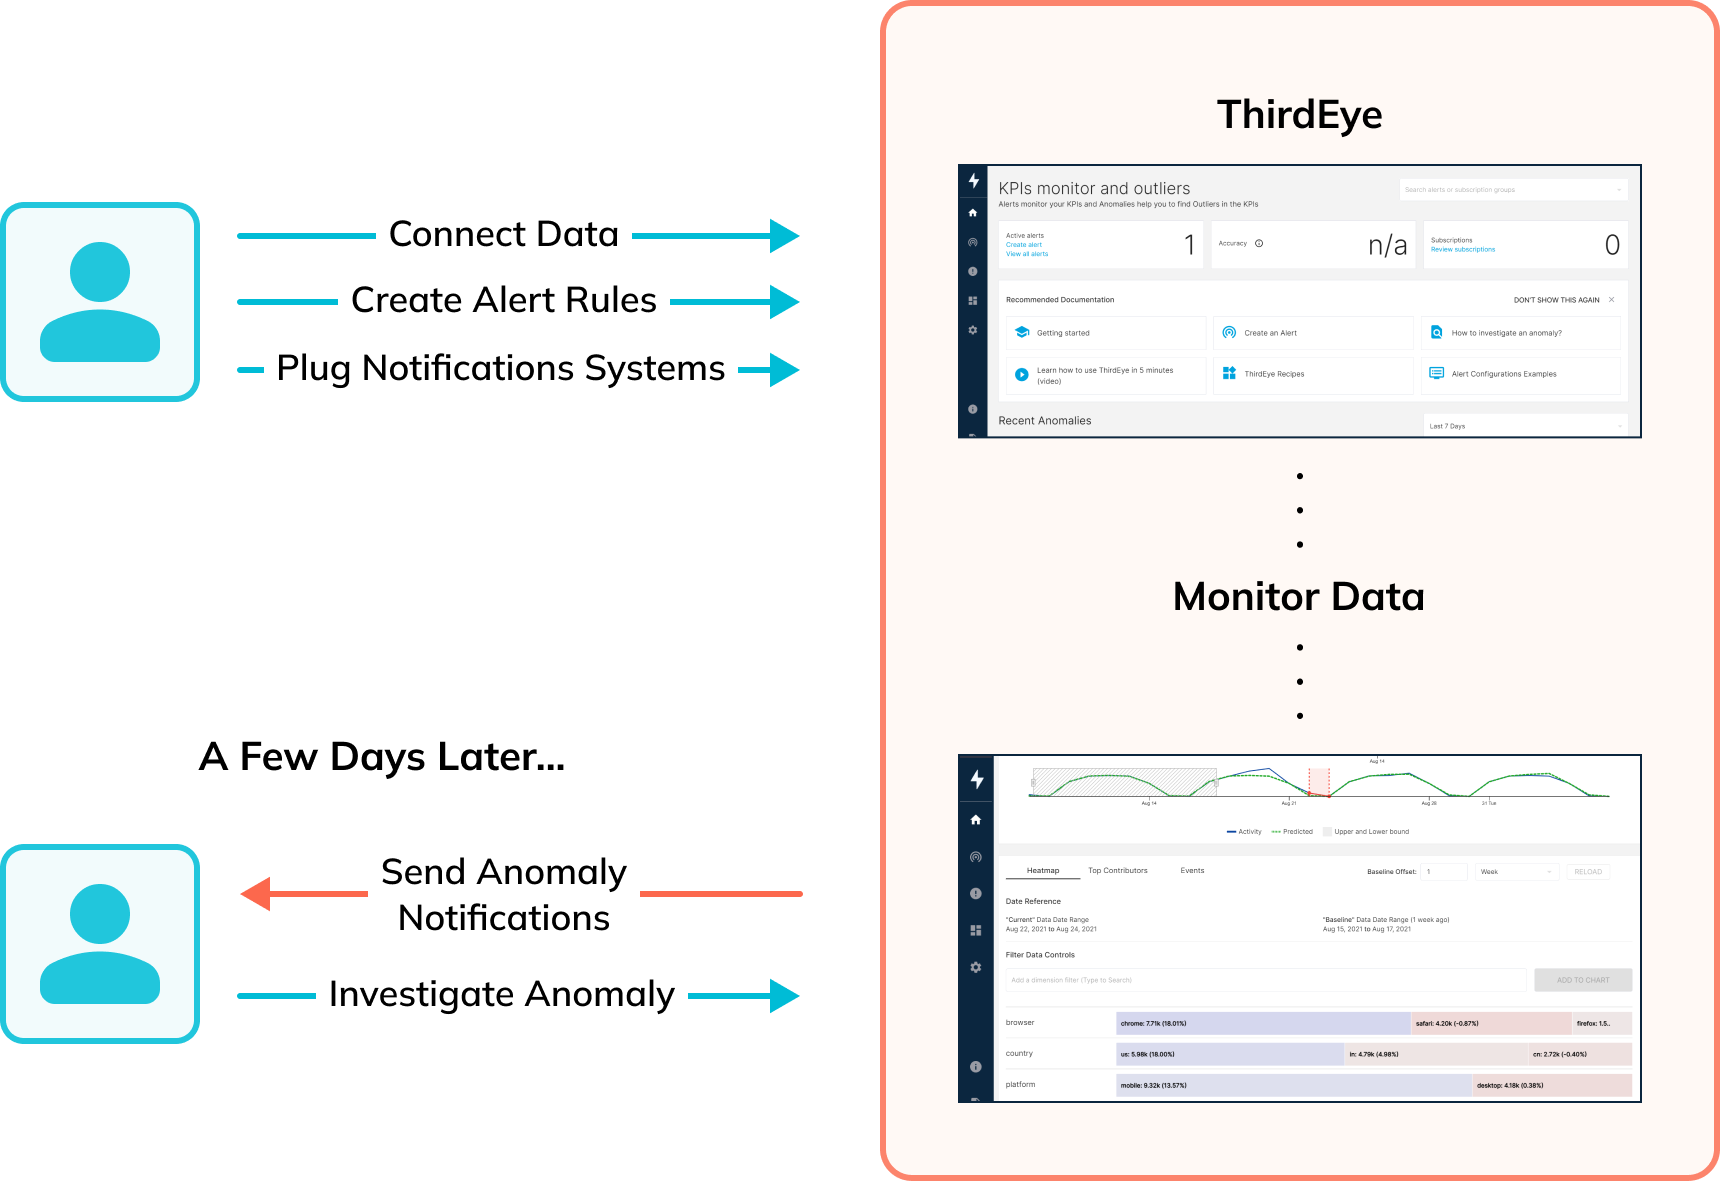
Here’s the same workflow in ThirdEye:

As you can see, ThirdEye makes the process much easier, faster, and intuitive while providing a friendly user interface.
Root Cause Analysis
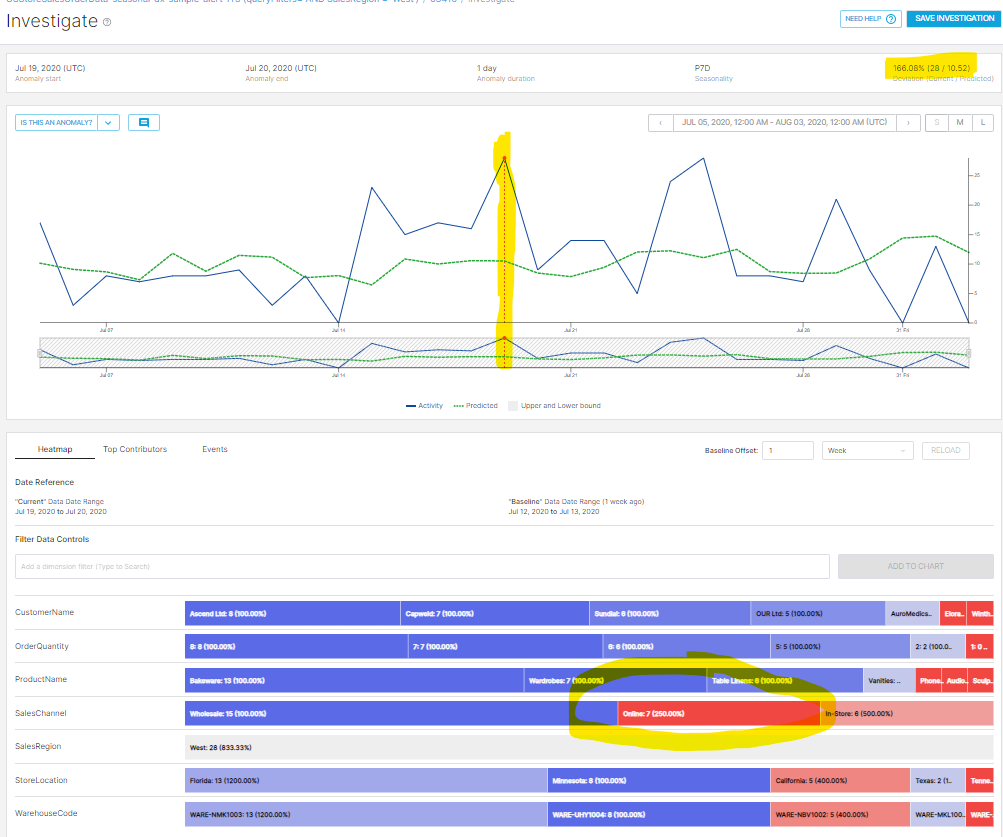
Beyond receiving an alert when an anomaly occurs, you’re able to perform root cause analysis using ThirdEye and identify the factor(s) that led to the problem. This way, you can figure out what went wrong and to what extent. Perhaps sales slowed because of high pricing or traffic from a specific region got blocked, or maybe the site went down, or a particular store encountered numerous issues. ThirdEye provides a heatmap—a visual representation of each dimension of data—showing what’s normal, lower than normal, and higher than normal so that the root cause easily pops out on paper.
Heatmaps
ThirdEye uses heatmaps to tell you if each metric or piece of information in your data has increased (blue) or decreased (red) for each anomaly, giving you a visualization of the good, the bad, and the ugly just by clicking a button!
The image below shows:
- The deviation from the mean as a percentage
- Where the anomaly occurred
- The potential cause in bright red or deep blue

Of course, an anomaly could occur for many reasons. When you can see what changed (red/blue) and what remained the same (gray) over time, you get a better idea of where to dig further and what steps to take.
ThirdEye recognizes that false positives, test results that incorrectly indicate the presence of a particular condition or attribute, do happen and provides a handy way of marking an anomaly as a false positive if needed. The application then learns from each identification and regards those events accurately from there.
Events
One scenario that we’ve yet to explore: What about expected special events? What if you were to run a one-day sale at your widget store? Most likely, you’d see an increase in sales for that day, but you don’t want the anomaly detection system to detect that as an anomaly. In ThirdEye, you can easily create an event that equates to the spike in sales.
Putting It All Together
StarTree ThirdEye, built on top of the best-in-class real-time OLAP database, allows you to create meaningful anomaly detection alerts for easy monitoring and rapid responses to business-altering conditions.

Get started in minutes with anomaly detection in ThirdEye by connecting your data and setting up alerts and notifications. Anomalies will automatically trigger the next set of activities, and you’ll be able to look at the root cause and respond in real-time.
To quote Joe Reis, “Most businesses barely do BI, let alone AI.” ThirdEye helps you with the BI part with very little effort.
If you want to leverage the data that you are already collecting and make use of it to improve your business, useability, and reliability, consider learning more about ThirdEye. If you have any questions about getting started, join me on Slack and attend one of our meetups—we’d be more than happy to help!

