This blog is the first in a series of blogs on integrating various visualization platforms with Apache Pinot. In this blog, I’ll focus on how to use Apache Superset and Apache Pinot together for data visualization.
Apache Superset is an open-source data visualization and data exploration platform designed to be highly intuitive and visually appealing. It allows users to create and share interactive dashboards and visualizations, supporting various data sources. Superset’s strength lies in its ability to provide a user-friendly interface for exploring and visualizing large datasets, making data analysis accessible to non-technical users.
Apache Pinot is a real-time distributed OLAP datastore, optimized for low-latency, high-throughput analytical queries. It is designed to provide instant insights on data at scale, making it a popular choice for applications in time-sensitive data analysis scenarios.
Why use Apache Superset + Apache Pinot?
Pairing Apache Superset with Apache Pinot makes sense due to the complementary strengths of the two popular Apache Software Foundation (ASF) sponsored open source software (OSS) systems. While Pinot provides the backend infrastructure capable of querying massive datasets at high speed, Superset offers the front-end interface that allows users to explore, visualize, and share those insights easily. Together, they form a powerful stack for real-time analytics, enabling users to derive actionable insights from their data rapidly.
Getting started with Superset and Pinot
As you start your own journey into Superset and Pinot, you may find the following resources of use.
- Superset Documentation
- Pinot with Superset Documentation
- Building a Climate Dashboard with Apache Pinot and Superset, by Kenny Bastani
- Apache Superset Slack
- Apache Pinot Slack
How to build a dashboard using Pinot and Superset
We need to deploy both Pinot and Superset to get started. To make life easier, I created a docker-compose for deployment.
NOTE: The Pinot Superset image supports the latest version of superset as well as dependencies defined in the requirements-db.txt.
You can get it from here: https://github.com/Barkha/apache-pinot-workshops/tree/main/SuperSetVisualization
1. Run the following command to start docker instances:
docker-compose up -dGive it some time to start, then verify deployment by navigating to:
http://localhost:9000 ←– Pinot
http://localhost:8088 ←– Superset
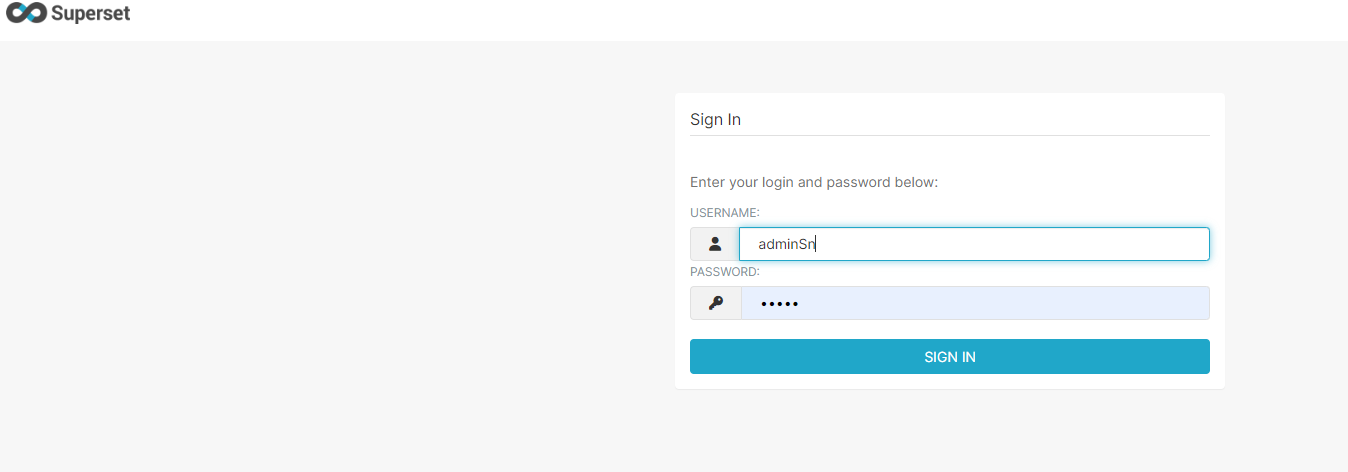
You should see Superset dashboard like so:
2. Create Superset admin
Before we go any further, we need to create the Superset admin account.
Let’s do that by running the following command in the Superset docker container:
# Get container id docker ps

    # create the admin user
    docker exec -it <containerid> superset fab create-admin --username admin --firstname Superset --lastname Admin --email [email protected] --password admin

    # upgrade and init superset
    docker exec -it <containerid> superset db upgrade
    docker exec -it <containerid> superset initCode language: PHP (php)
This should complete the Superset setup. Next, we will connect to Pinot.
Before we connect to Pinot, verify that the Pinot server is up by navigating to http://loacalhost:1000
You can check that tables were created and data exists by navigating to: http://loacalhost:1000/#/query
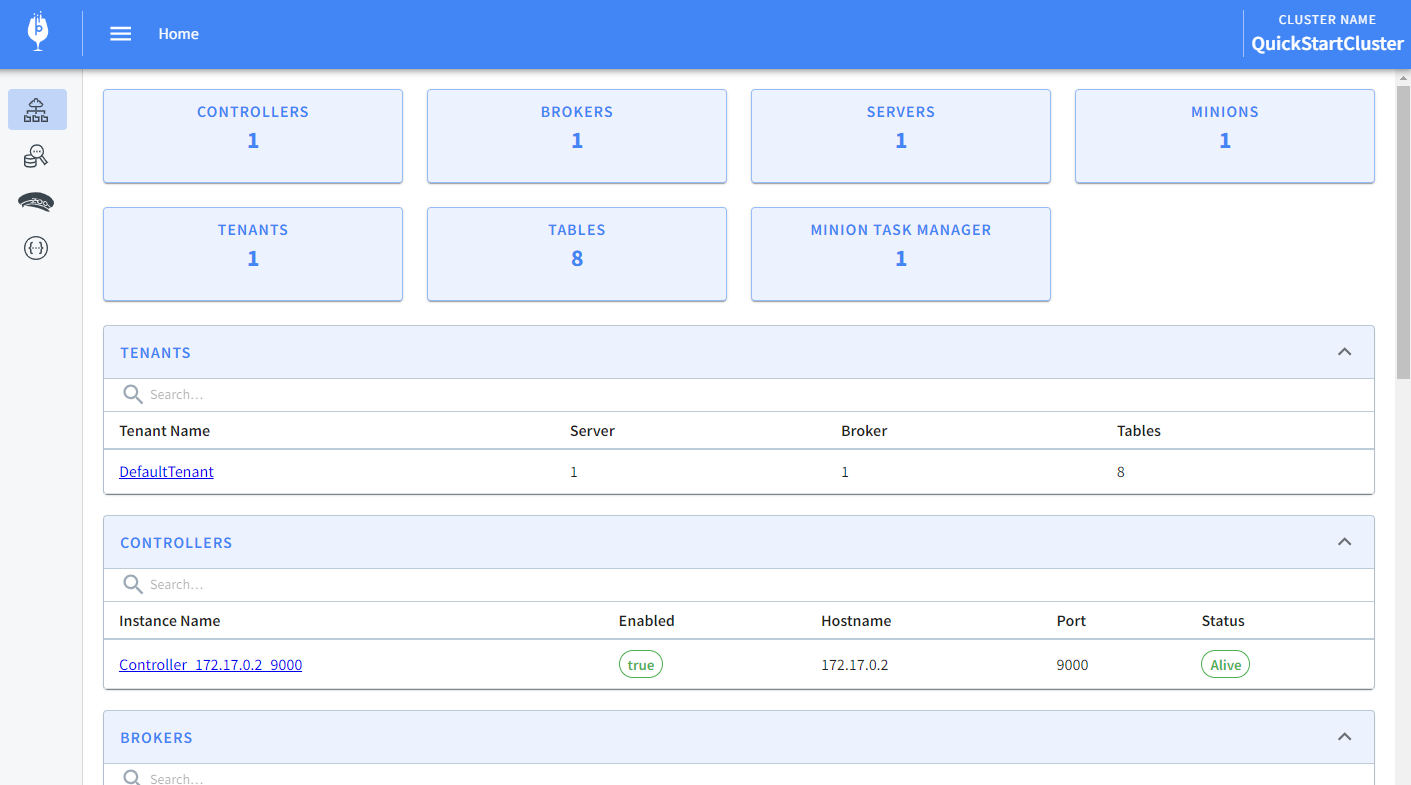
Notice that we have eight tables. Good.
3. Connecting Superset to Pinot
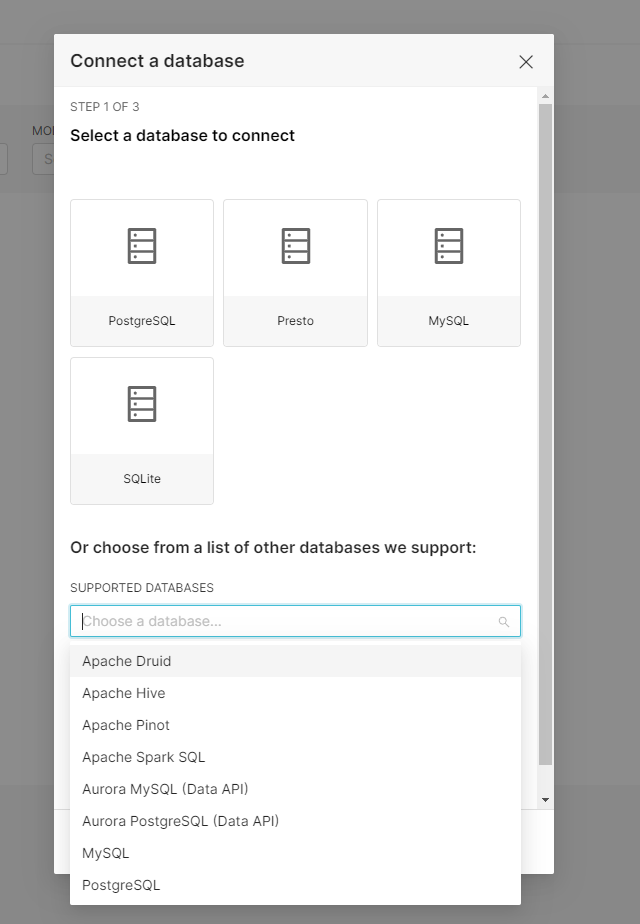
Let’s connect Superset to Pinot. To do this, Navigate to out SuperSet deployment at https://localhost:8088 , them select the Settings -> Database Connections
Because we are running the image with a built-in Pinot connector, you will see Apache Pinot in the drop-down.
Connection string format:
Superset connecting string format is:
engine+driver://user:password@host:port/dbnameCode language: JavaScript (javascript)For our deployment of Pinot, the connectionstring is:
pinot://pinot:8000/query/sql?controller=http://pinot:9000Code language: JavaScript (javascript)Where the engine + driver is pinot, the docker URL for our pinot broker deployment is pinot:8000/query/sql and the controller URL is pinot:9000.
You can change the URLs based on your deployment, and add the user:password if needed.
At this point, Test Connection and save.
4. Add dataset
Once you have a connection, you can add datasets. Select the Dataset option from the top menu:
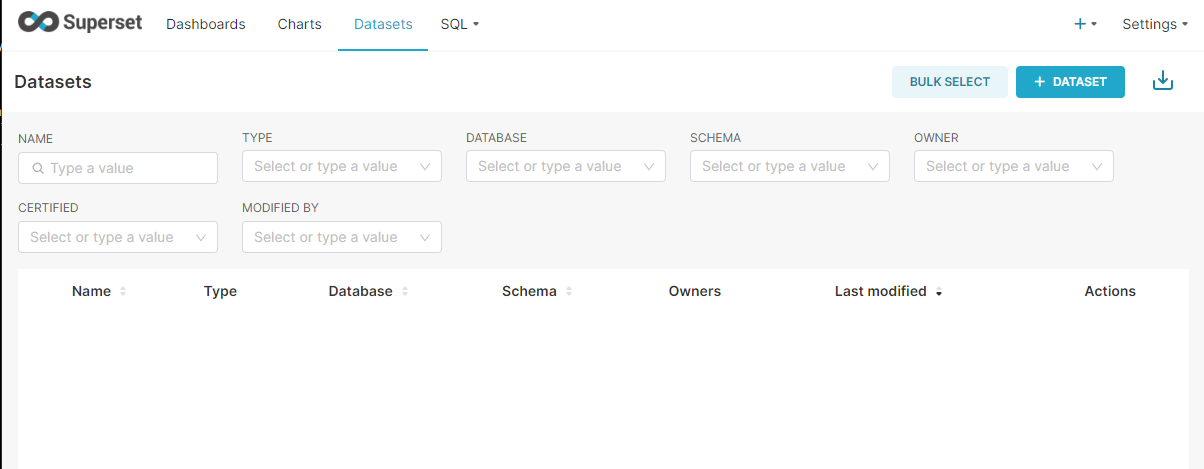
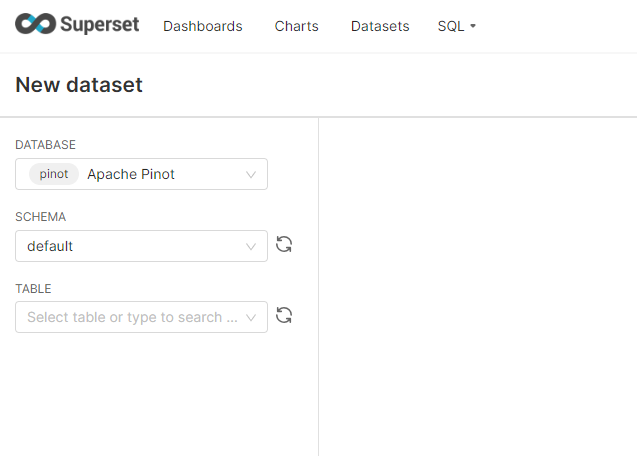
Select the “+ Dataset” button, and select BaseBallStats:
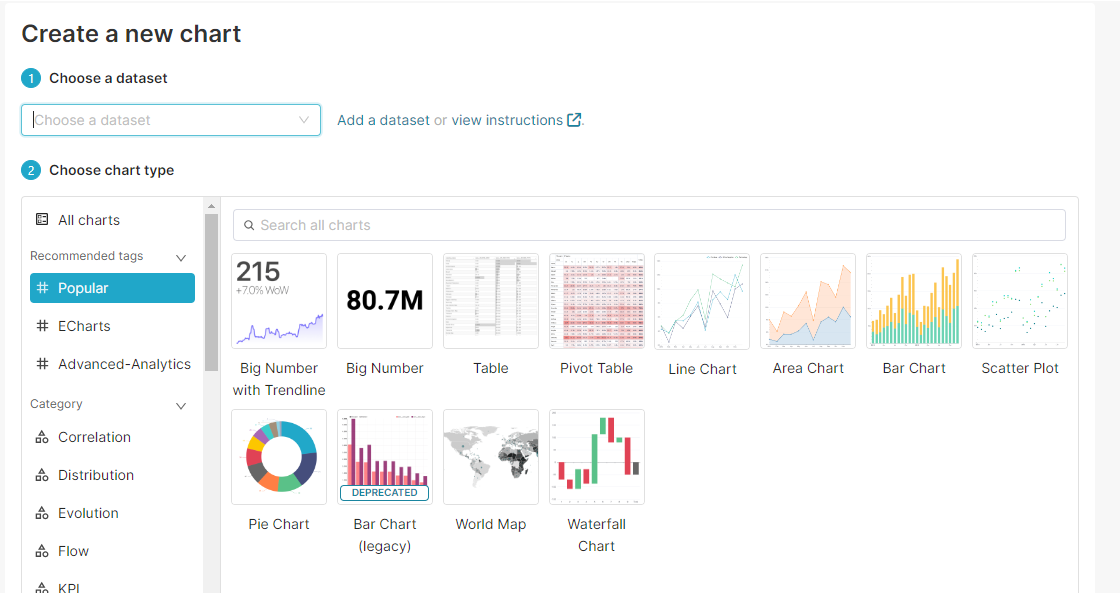
This will take you to the create a chart screen:
5. Create new charts
Select the Scatter Plot and set the dimensions and Metric by choosing YearID and SUM(hits):
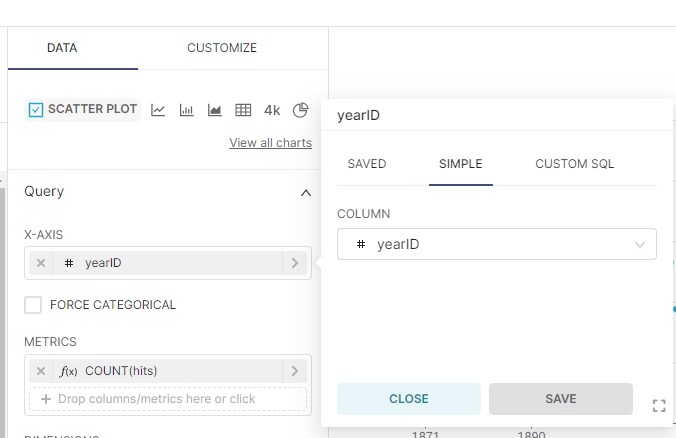
Hit the create Chart button to see the chart. Next, name your chart and save. This will prompt you to add to a Dashboard. You can create a new dashboard at this point.
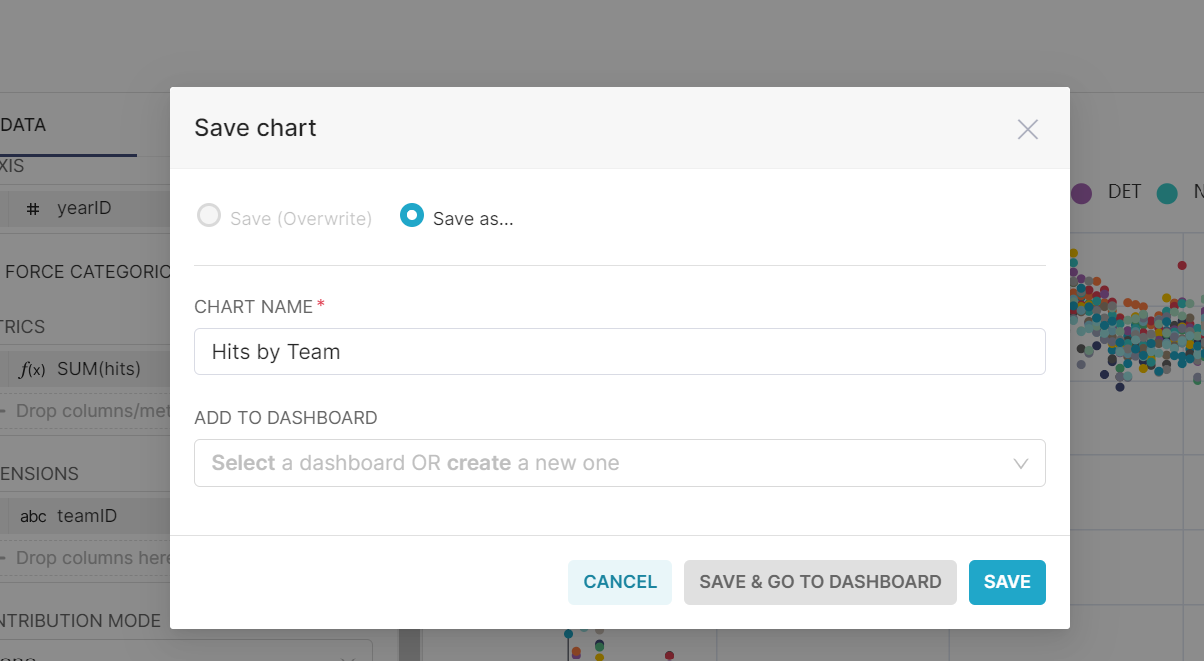
Next, you can navigate to the dashboard, and drag and drop the chart where you want it and save. At this point, you can play around and add some more charts.
Here’s one of my dashboards:
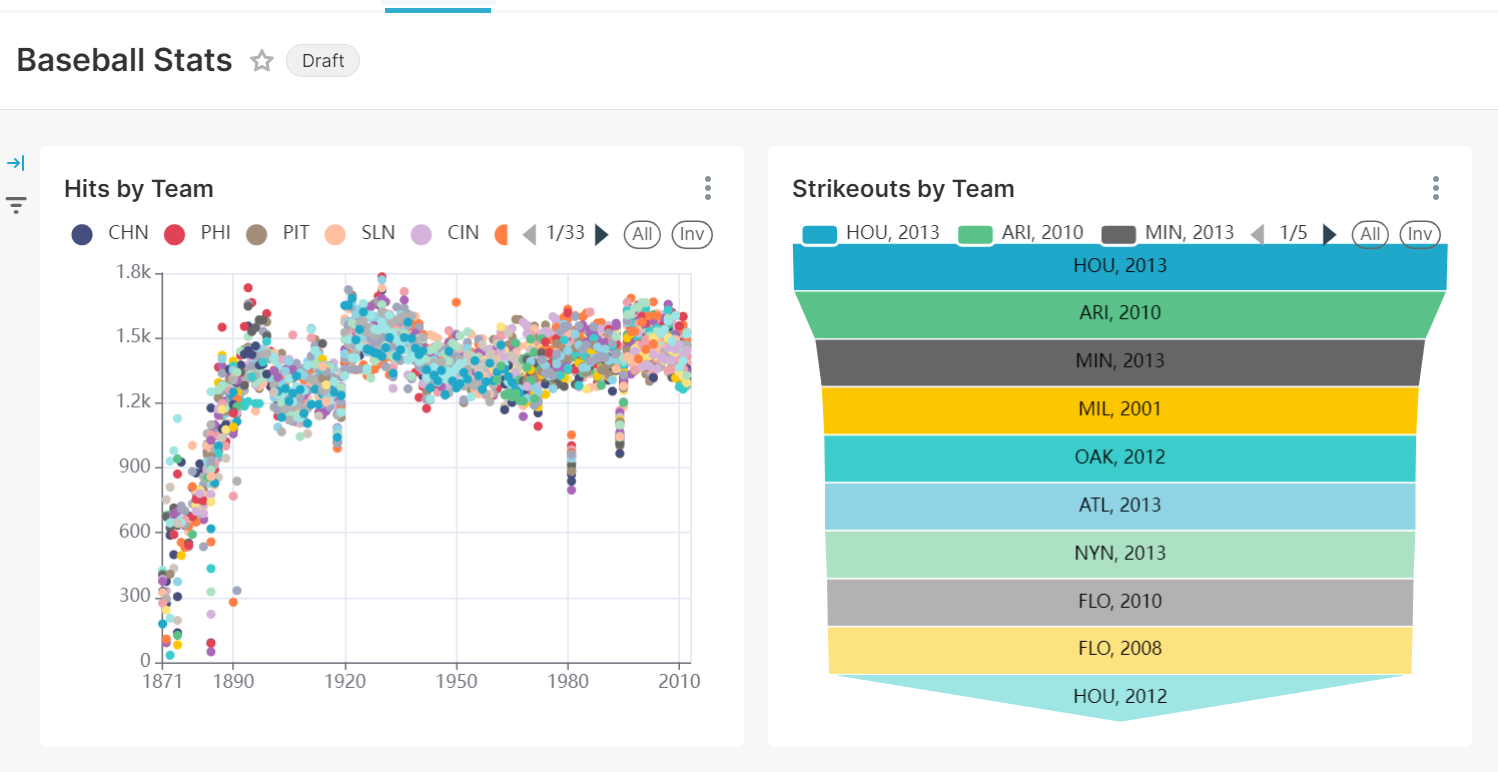
There you have it! You have successfully created a dashboard using Superset, with a Pinot back end.
We have just scratched the surface of Superset functionality and the power of Pinot.
6. Import/export dashboards
Superset also allows users to Export and Import Dashboards. You can export our newly created dashboard by selecting Dashboard from the top Menu, and selecting export as shown here:

You can import previously created dashboards by choosing import as shown here:

For your convenience, you will find same already created dashboards for Apache Pinot Sample data here: https://github.com/Barkha/apache-pinot-workshops/tree/main/SuperSetVisualization
Concluding thoughts
Apache Superset serves as a crucial bridge between raw data and actionable insights. Its ability to integrate with various data sources like Apache Pinot, combined with its user-friendly interface and powerful visualization capabilities, makes it an invaluable tool in today’s data-driven landscape. Whether for real-time analytics, periodic reporting, or ad-hoc data exploration, Superset empowers organizations to harness the full potential of their data, fostering a culture of informed decision-making and strategic insight.
Want to see try building your own dashboards with Apache Pinot and Superset? Request a trial to get started with a managed Apache Pinot service on StarTree Cloud. Or Book a demo if you have questions and would like a quick tour of how StarTree Cloud can work for you.

