Summary
- Cisco Webex uses Apache Pinot to support Grafana and Kibana visualizations
- Cisco Webex manages >100TB telemetry daily using Apache Pinot
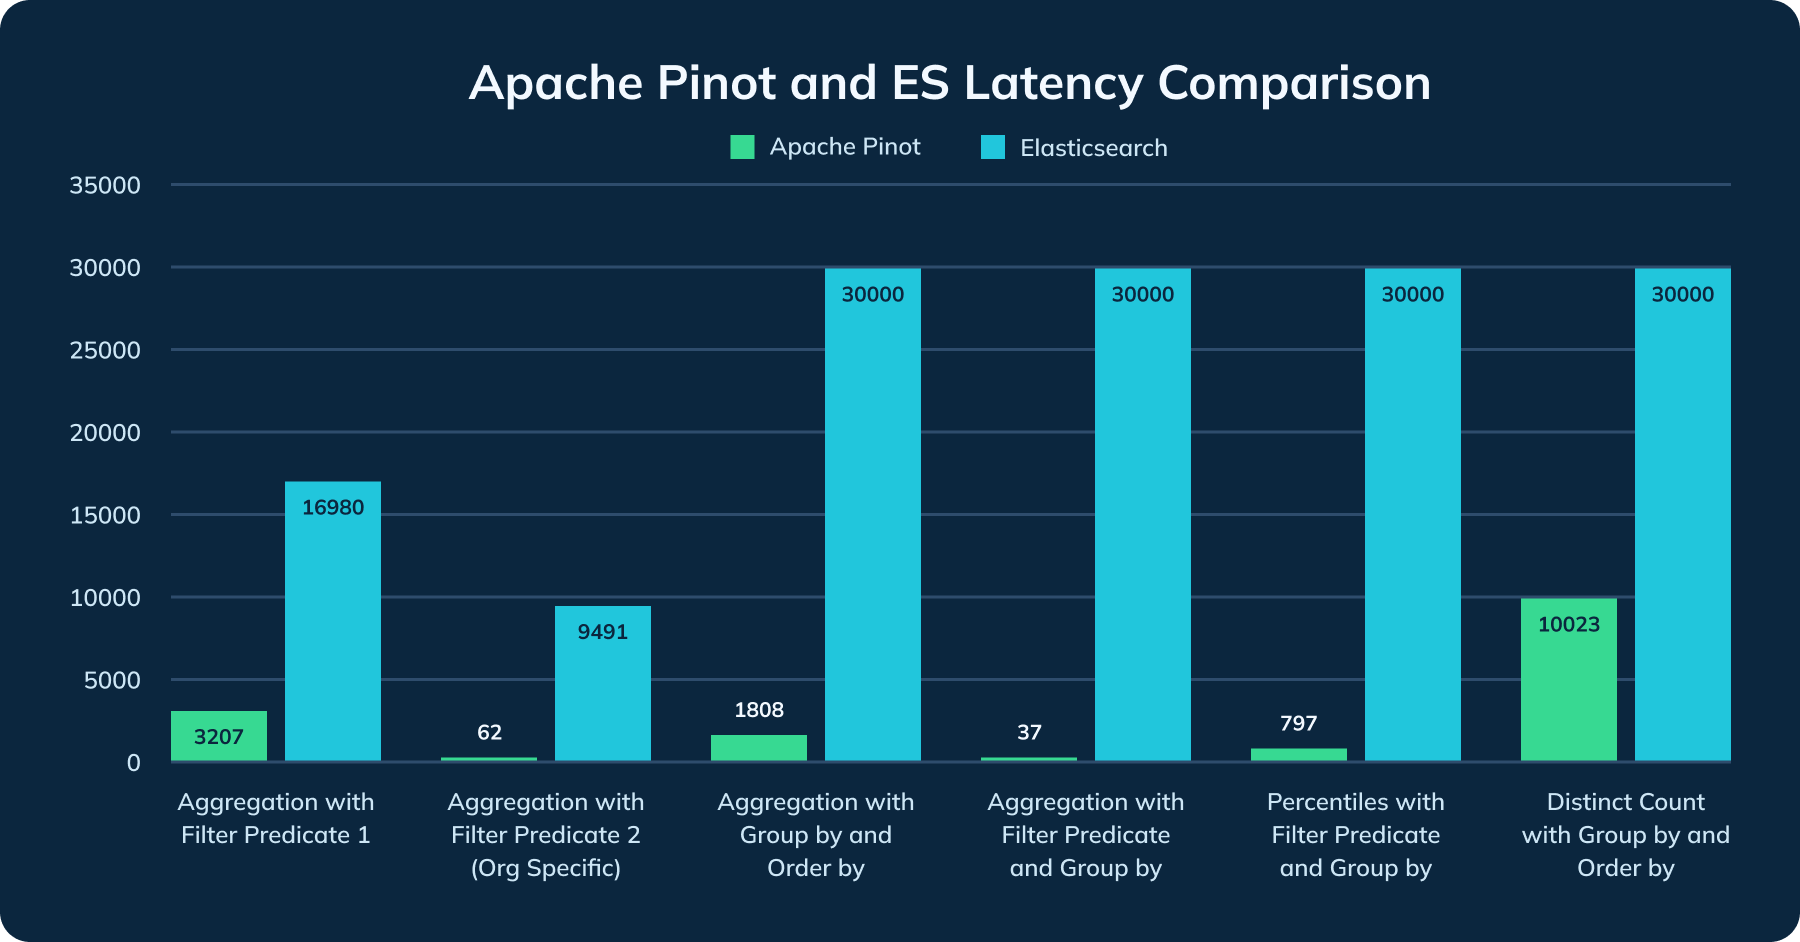
- Cisco Webex found Apache Pinot P99 latencies 5× to 150× lower than Elasticsearch
- Cisco Webex obtained subsecond latencies with Apache Pinot in most tested cases, whereas Elasticsearch timed out (>30 seconds) in 67% of cases
- Cisco Webex shrank their cluster by >500 nodes moving from Elasticsearch to Apache Pinot
Cisco Webex turns to Apache Pinot and Grafana for real-time observability
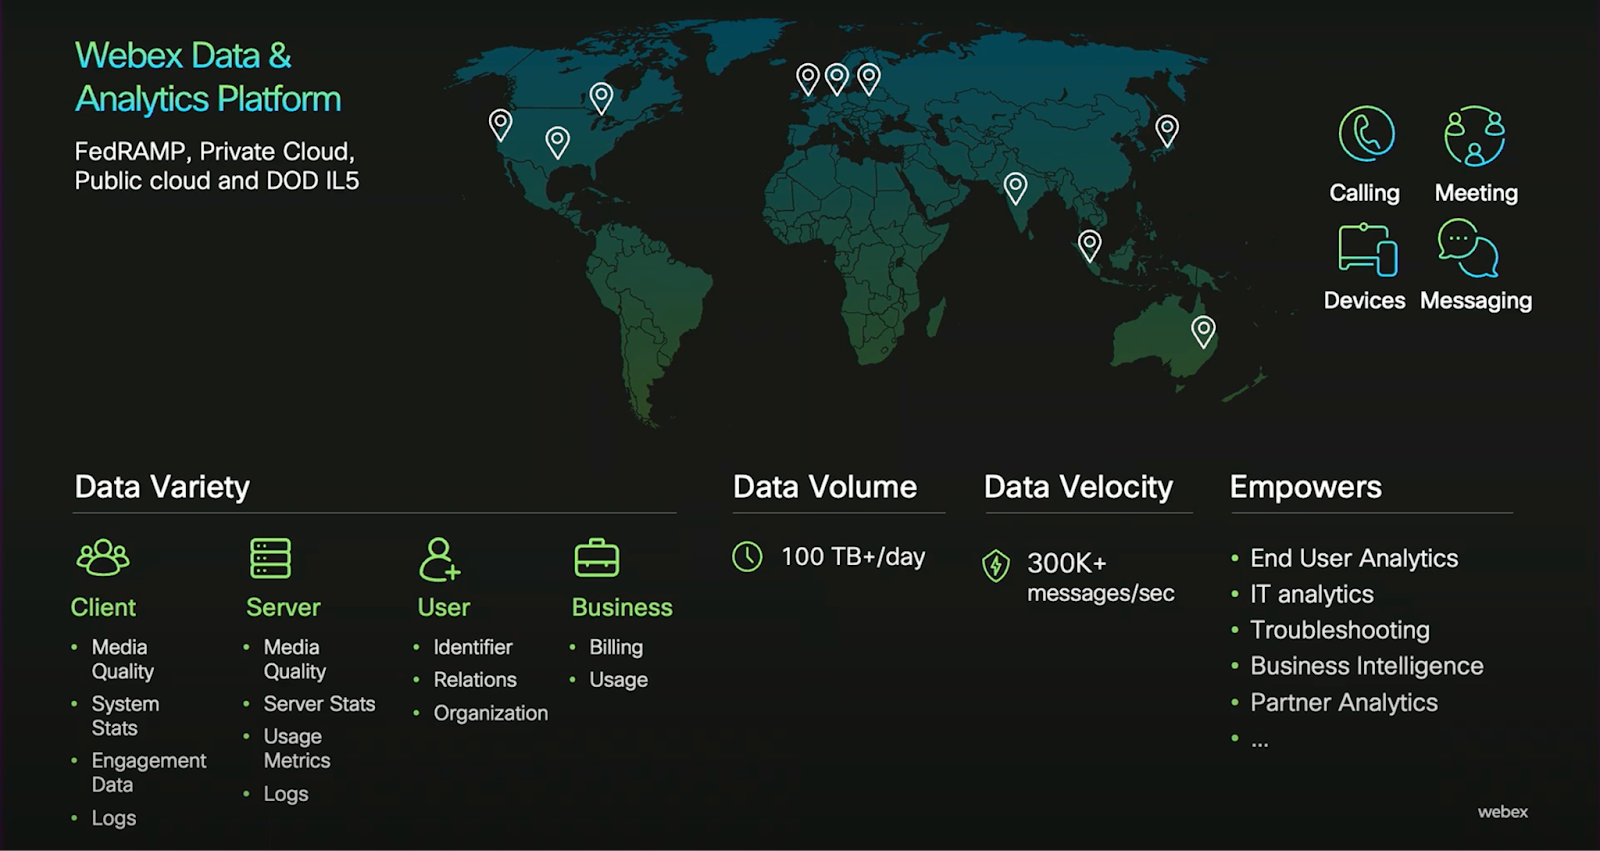
Cisco Webex launched in 1995 and saw continual steady growth, yet with the COVID-19 pandemic the shift to remote work saw usage skyrocket. Webex Meetings needed to scale to support over 100 TB of telemetry data per day, at a velocity of over 300k messages per second at peak load — more than a billion events per day. This requires a lot of observability to keep in good working order to avoid or minimize issues, such as indications of video or audio jitter. Webex turned to Apache Pinot and Grafana for a complete open source solution for real-time analytics and observability of their global platform.
Watch now
Apache Pinot vs. Elasticsearch: Benchmarking real-time analytics
What was the best way to implement a real-time analytics solution at such a massive scale? For Cisco Webex, they began with the queries. This was the list of conceptual questions the team came up with, along with the way to implement them in standard SQL queries:
- How is the audio/video quality across customers? (Aggregation with Filter Predicate 1)
- How is the audio/video quality for a specific customer? (Aggregation with Filter Predicate 2: Org-Specific)
- How many users are joining via browser and not the app? (Aggregation with GROUPBY and ORDERBY)
- Grade the audio/video quality of users joining va different clients (Aggregation with filter predicate and GROUPBY)
- What is the p99 of overall audio/video quality experience by regions (Percentiles with filter predicate and GROUPBY)
- Number of users adopting a feature like breakout rooms or noise reduction (Distinct COUNT with GROUPBY and ORDERBY)
To be able to answer these questions accurately in real-time, a critical early decision was to not pre-aggregate metrics data, but to do runtime aggregations. Since observability is looking for sudden changes and stochastic events — phenomena that cannot be readily predicted — pre-aggregations are wholly unsuitable. It is instead important to enable runtime queries to find emerging, salient patterns in real-time. To do runtime aggregations required preserving all of the billion daily events across more than 150 dimensions. (Since launch they’ve expanded to more than 650 dimensions.)
Apache Pinot for faster performance
Originally this data was stored in Elasticsearch with weekly rolls up that moved to a “warm” store. Responses were slow, and the rollups limited the lookback periods the team could analyze. Apache Pinot was chosen as a replacement because it was designed from the ground-up as a real-time analytics database. When the Cisco Webex team benchmarked Elasticsearch and Apache Pinot head-to-head against the same data set, what became apparent was how fast Apache Pinot was able to produce results, even with higher concurrency. In fact, in the majority of test cases — especially those that had higher concurrency or greater complexity — Elasticsearch was unable to produce results at all before timing out of the 30 second window.
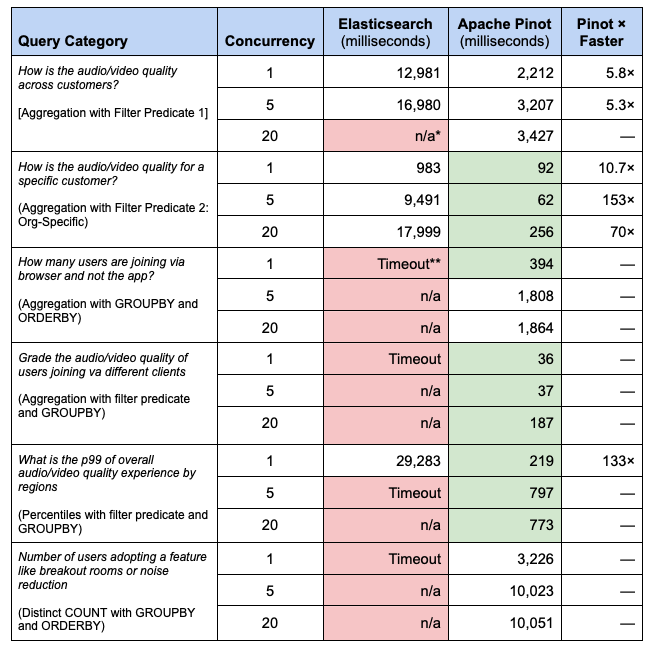
* Tests not run due to bad performance at a lower concurrency or related category
** Timeouts were set at 30 seconds; if a test timed out, Cisco Webex chose not to test at higher concurrencies.
Cisco Webex’s tests showed Apache Pinot provided between 5× to 150× better performance for their analytical queries compared to Elasticsearch. In two thirds of the test scenarios — 12 out of the 18 cases — Elasticsearch could not even produce results within the timeout window of 30 seconds.

In comparison, for the majority of cases Apache Pinot produced results at subsecond scales, with latencies as low as 36 milliseconds. Even with the most computationally taxing of queries Apache Pinot could return results within 2 to 10 seconds, well below the timeout window. On top of this, using the HyperLogLog algorithm within Apache Pinot, these basic 10 second query results can be optimized to perform at subsecond times.
Apache Pinot for efficient infrastructure utilization
Beyond performance, the actual amount of data stored was reduced by nearly an order of magnitude. Elasticsearch stores data in JSON format, where the name of the field itself can be quite large compared to the numerical value. By moving from Elasticsearch to Apache Pinot, total data under management was reduced from 800 TB of unique data to 121 TB (replicated 3× this is ~360 TB). This reduction in storage accounted for a savings of over 500 instances.
The cluster Cisco Webex deployed Apache Pinot on is still quite sizable, providing them the capacity to handle their current traffic with plenty of room for growth:
- Instances: 142
- CPUs: 28 per instance (3,976 total)
- Memory: 128 GB per instance (18,176 GB total)
- Disk: 3 TB per instance (426 TB total)
Apache Pinot integration with Grafana and Kibana
Just because the system itself is fast doesn’t mean the organization is ready to shift to use it. Instead, the system has to be integrated into the tools the organization already knows and uses. The internal SREs that rely upon this data wanted to maintain their usual alerting mechanisms and their familiar dashboard environments within Grafana and Kibana.
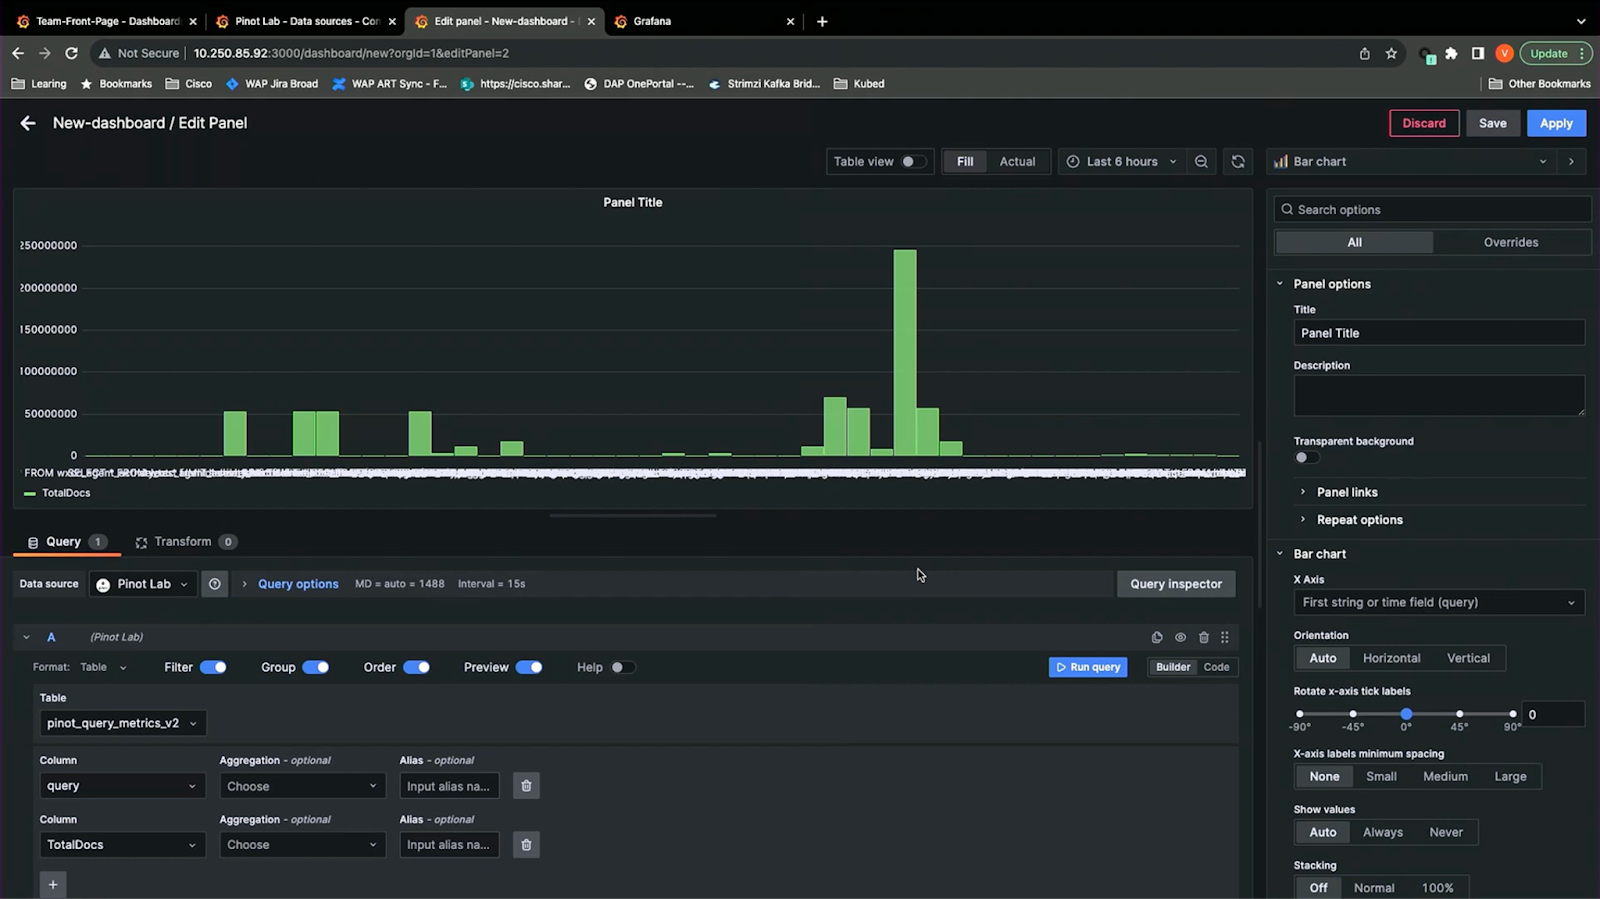
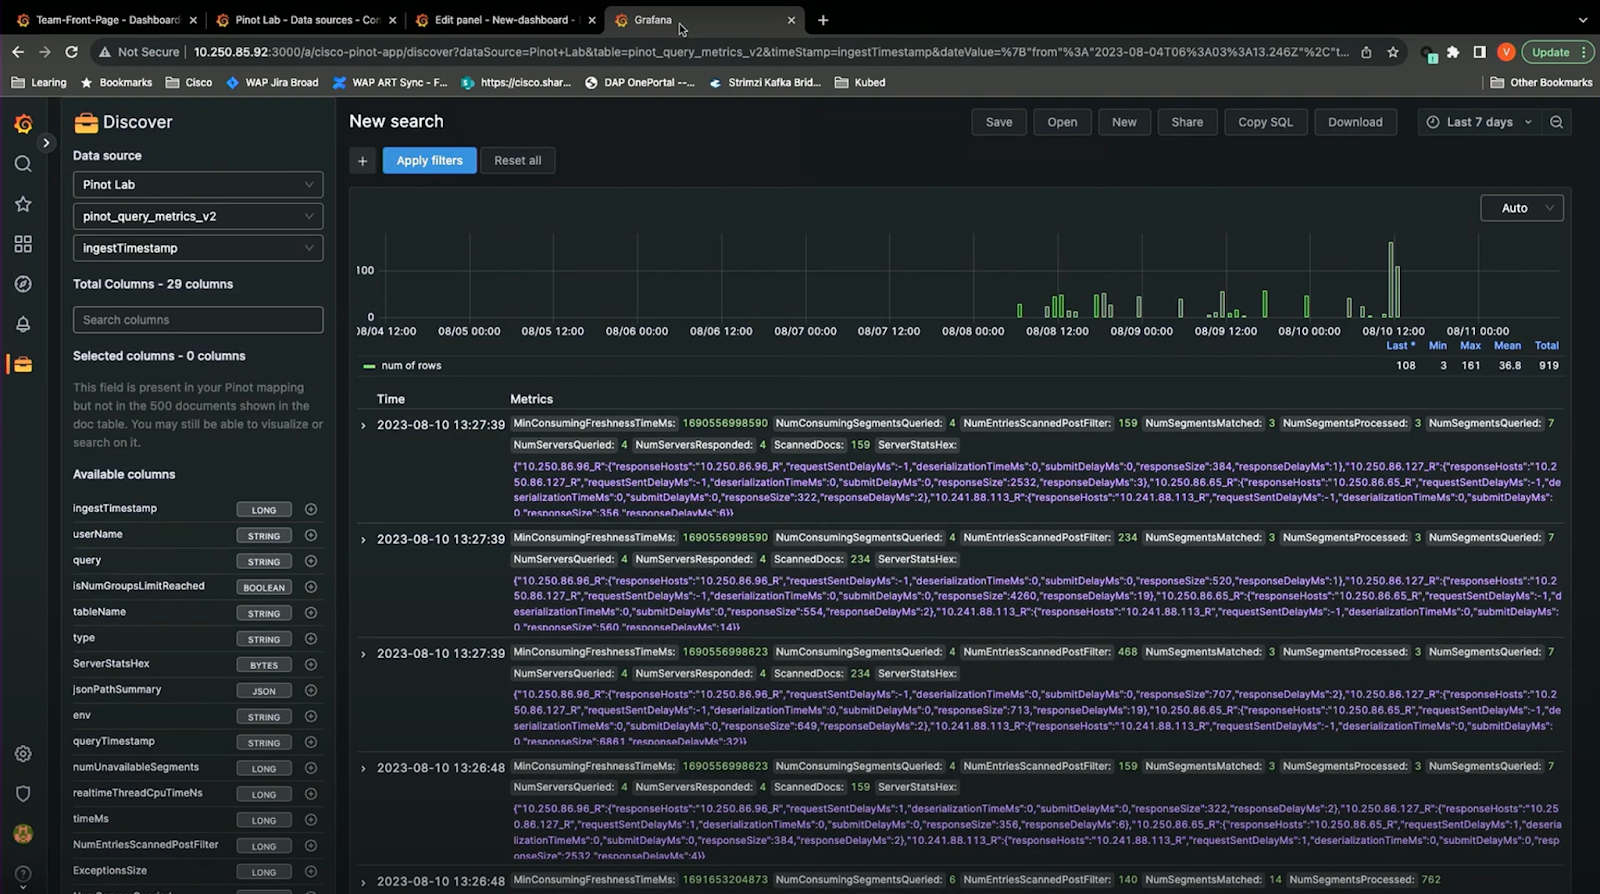
To move completely to an Apache Pinot back-end, the Cisco Webex team created an Apache Pinot datasource plugin for Grafana. (Note this is different from simply monitoring Apache Pinot from Grafana/Prometheus, which is already available.) The solution the Cisco Webex team developed is a work-in-progress; it is not yet open source. Beyond allowing creation of basic dashboards via the Builder tool, more powerful is the ability to directly add your own code for more granular searches using regular expressions (regex) or division operations.
The next tool they built was a Kibana integration to allow their internal users to better and more fully explore the data they have access to. To accomplish this they needed to change the basic data formats they handled from the JSON stored in Elasticsearch to the efficient hex values stored in Apache Pinot.
More open source contributions from Cisco Webex
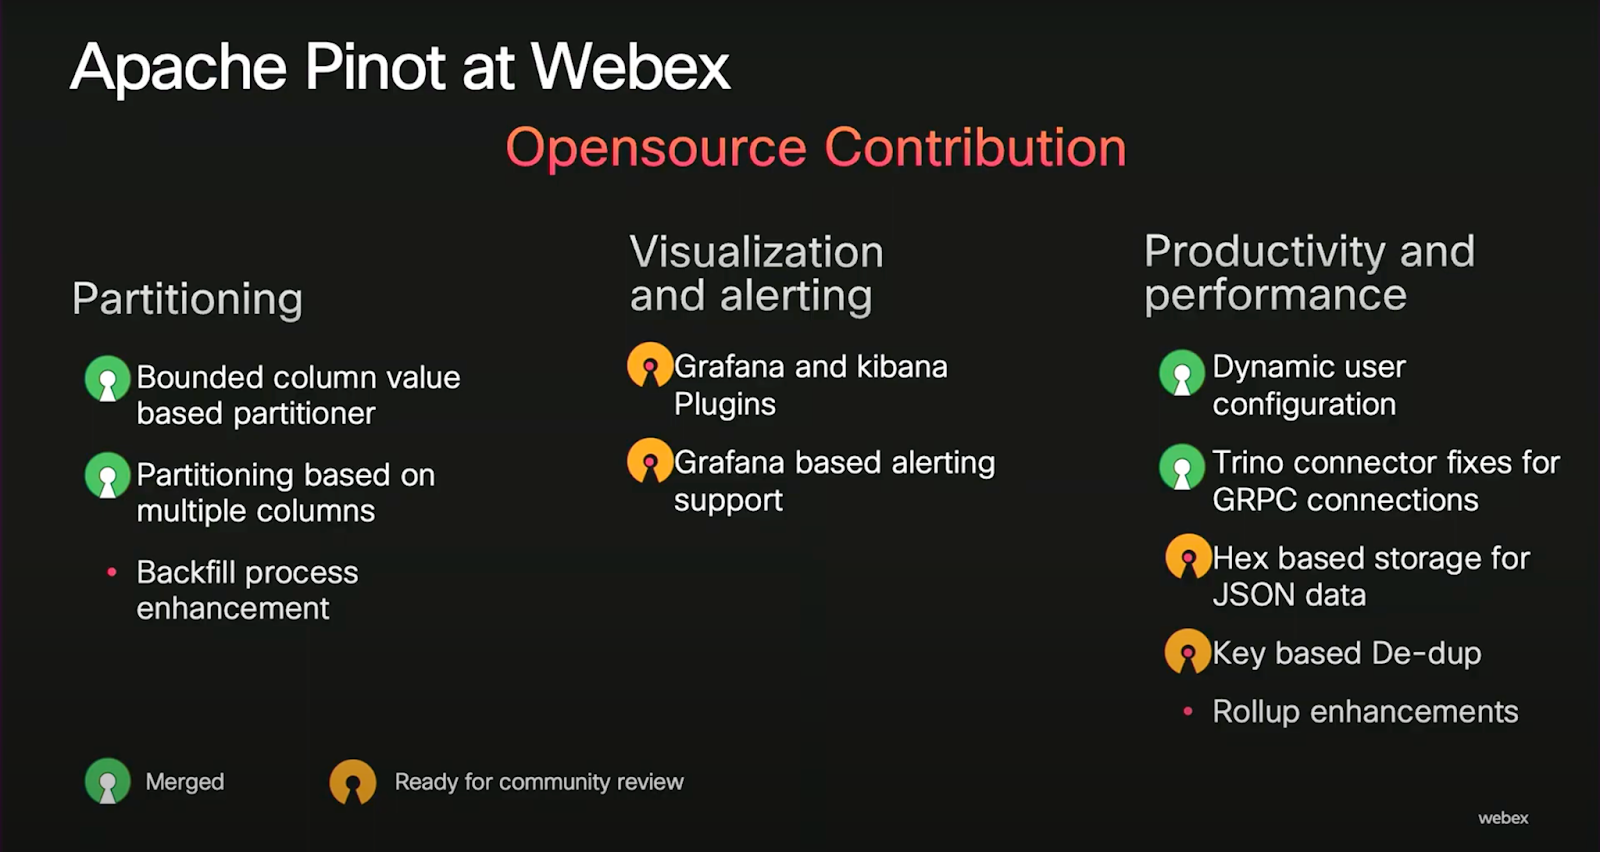
These two contributions for open source visualization and alerting are currently open for community review, and are just two of many open source contributions the Webex team have committed to the Apache Pinot ecosystem. A complete list of open source work done by the Webex team:
Partitioning
- Bounded column value based partitioner*
- Partitioning based on multiple columns*
- Backfill process enhancement**
Visualization and alerting
- Grafana and Kibana plugins***
- Grafana-based alerting support***
Productivity and performance
- Dynamic user configuration*
- Trino connector fixes for gRPC connections*
- Hex-based storage for JSON data***
- Key-based deduplication***
* Already merged into Apache Pinot
** Roll-up enhancements
** Ready for community review
Learn more about Apache Pinot at Cisco Webex
In summary, Cisco Webex found Apache Pinot provided them with superior performance to their prior search engine based platform using Elasticsearch. It allowed them to shrink their cluster by nearly an order of magnitude, while providing latencies that were 5× to 150× lower.
To find out more about the details of Cisco Webex’s use of Apache Pinot, and their contributions to the open source community, watch the video in full. Plus make sure to check out why Cisco adopted Apache Pinot instead of Clickhouse.
Try Apache Pinot on StarTree Cloud
The easiest way to experience the power of Apache Pinot is with StarTree Cloud. Request a Trial to get started with a no-commitment trial account to explore and test. When you’re ready to move into production, you can move into one of our cost-effective packages just right for your business.
