The Business Value Of Real-Time User-Facing Analytics

When one hears “decision maker,” it’s natural to think, “C-suite,” or “executive.” But these days, we’re all decision-makers. Yes, the CEO is a crucial decider… but so too is the franchise owner, the online shopper, the student.
Yet it has been traditional decision-makers who have had access to relevant data to guide their thinking. There simply has not been an easy way to scale real-time analytics tools for widespread use—let alone present them in an intuitive way that allows users to act on the information being shared.
In other words, “Everyone is a Data Person but only a select few have access to the insights data” — this is about to change!
That situation is changing with the emergence of user-facing analytics: Giving users access to real-time data and analytics from within the product App or platform where they can take action. One of the best examples is LinkedIn’s “Who Viewed My Profile” application, which gives 700 million-plus LinkedIn users access to fresh insights.
But it’s not just access to data that users get. It is the ability to use that data to, for example, make a new connection just as they become aware of a profile. In other words, to add value, it is not enough to provide reports or a dashboard to users. The data must be presented at just the right point in time to capture an opportunity for the user. Each LinkedIn member gets a personalized dashboard of all the profile views broken down by industry, location, job title, and week-over-week trend analysis. This enables the user to connect with the right people, leading to better opportunities, and accelerates LinkedIn’s mission of connecting the world’s professionals.
This is a difficult challenge precisely because the value of data varies over time. If a handful of data analysts are looking at data in aggregate to pick out trends, it is a fairly straightforward task. But try to pick out those events that will be of value to thousands of users, at any time, and it becomes clear that we are charting new territory.
The Value of Data Over Time
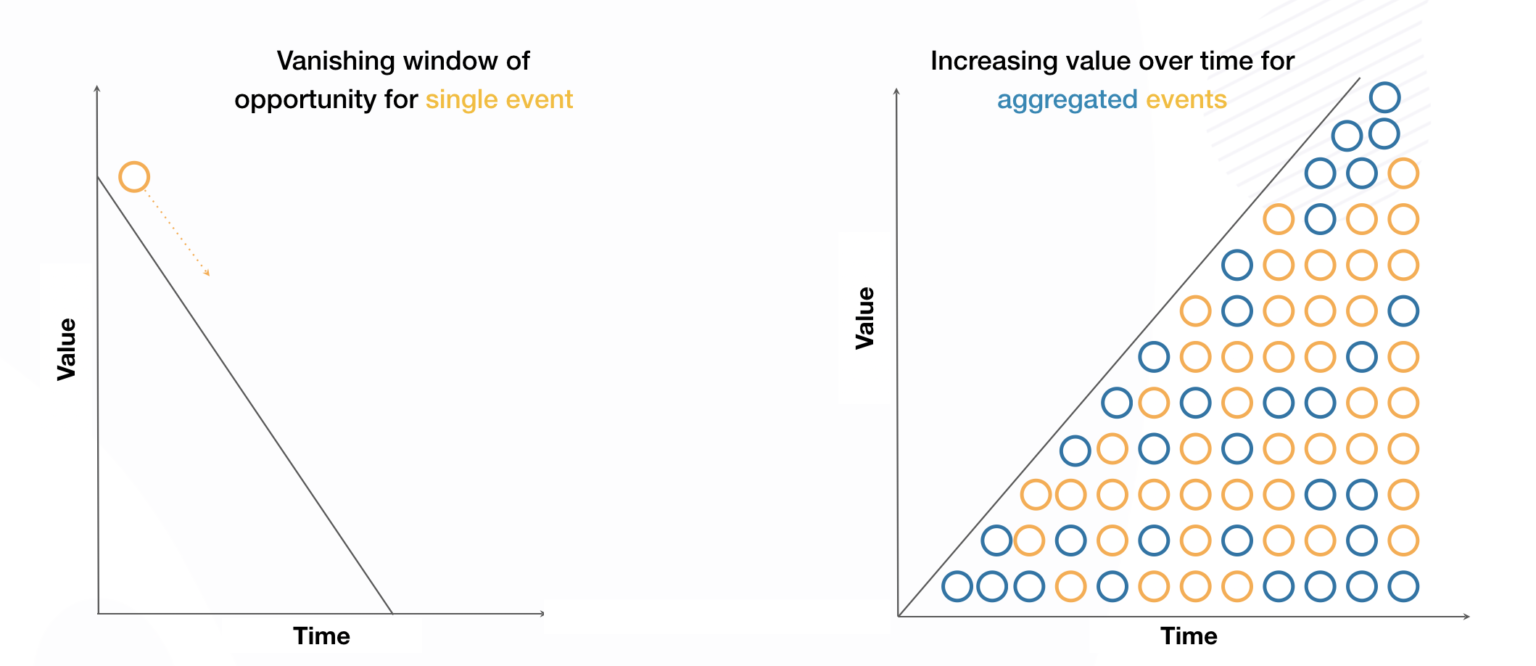
Let’s take a single event that gets captured digitally—for example, someone searches for the term “pizza” in a delivery app. What is the value of knowing everything about that single event?
The question makes sense only if we chart the value of that event over time. At the point in time when the search happens, the event has a high value: It is signaling that someone, somewhere, is actively searching to buy ad pizza. If you knew when that happened, you could offer those people a coupon, for example, for establishments in that person’s area that happen to sell pizza. There is value because the user’s intent is well defined and immediate.
The value of this information drops off very quickly, however. It’s no use knowing that someone wanted pizza yesterday. By the time you discover this fact today, chances are that the person already bought and enjoyed pizza from a competitor.
This illustrates a general principle: For single events, the value of the data drops off very quickly over time.

Now let’s look not at a single event, but events in aggregate. To extend our example, we are looking not at a single person searching for nearby pizza, but at all the people who searched for pizza within an area and over time. By looking at the aggregate data, we can learn new things. We can search for trends and do some forecasting, for example.
So aggregate data shows an opposite pattern from single-event data: It might not be exceptionally valuable at the time of any one event, but its value increases dramatically over time as it allows for better and better forecasts.
There are times, too, when you need both to make sense of even a single event—if you’re doing fraud analytics, for example. And there is the challenge: Most systems are designed to handle one kind of data or the other, either single events or aggregate data. Many organizations end up using different systems, depending on specific use cases, which can get messy.
What would be ideal is to have both single events and aggregate data in one system, with both available quickly enough to be useful across many cases. This was one of the main goals of developing Pinot.
What this does is, essentially, expand the user for your data in new and innovative ways. Providing your users with actionable data allows you to bring more value, using something you already have.
To see this, let’s ask: Just who are the users—and consumers—of data?
Who Are the Everyday Decision Makers? Who are the Users of User-Facing Analytics?
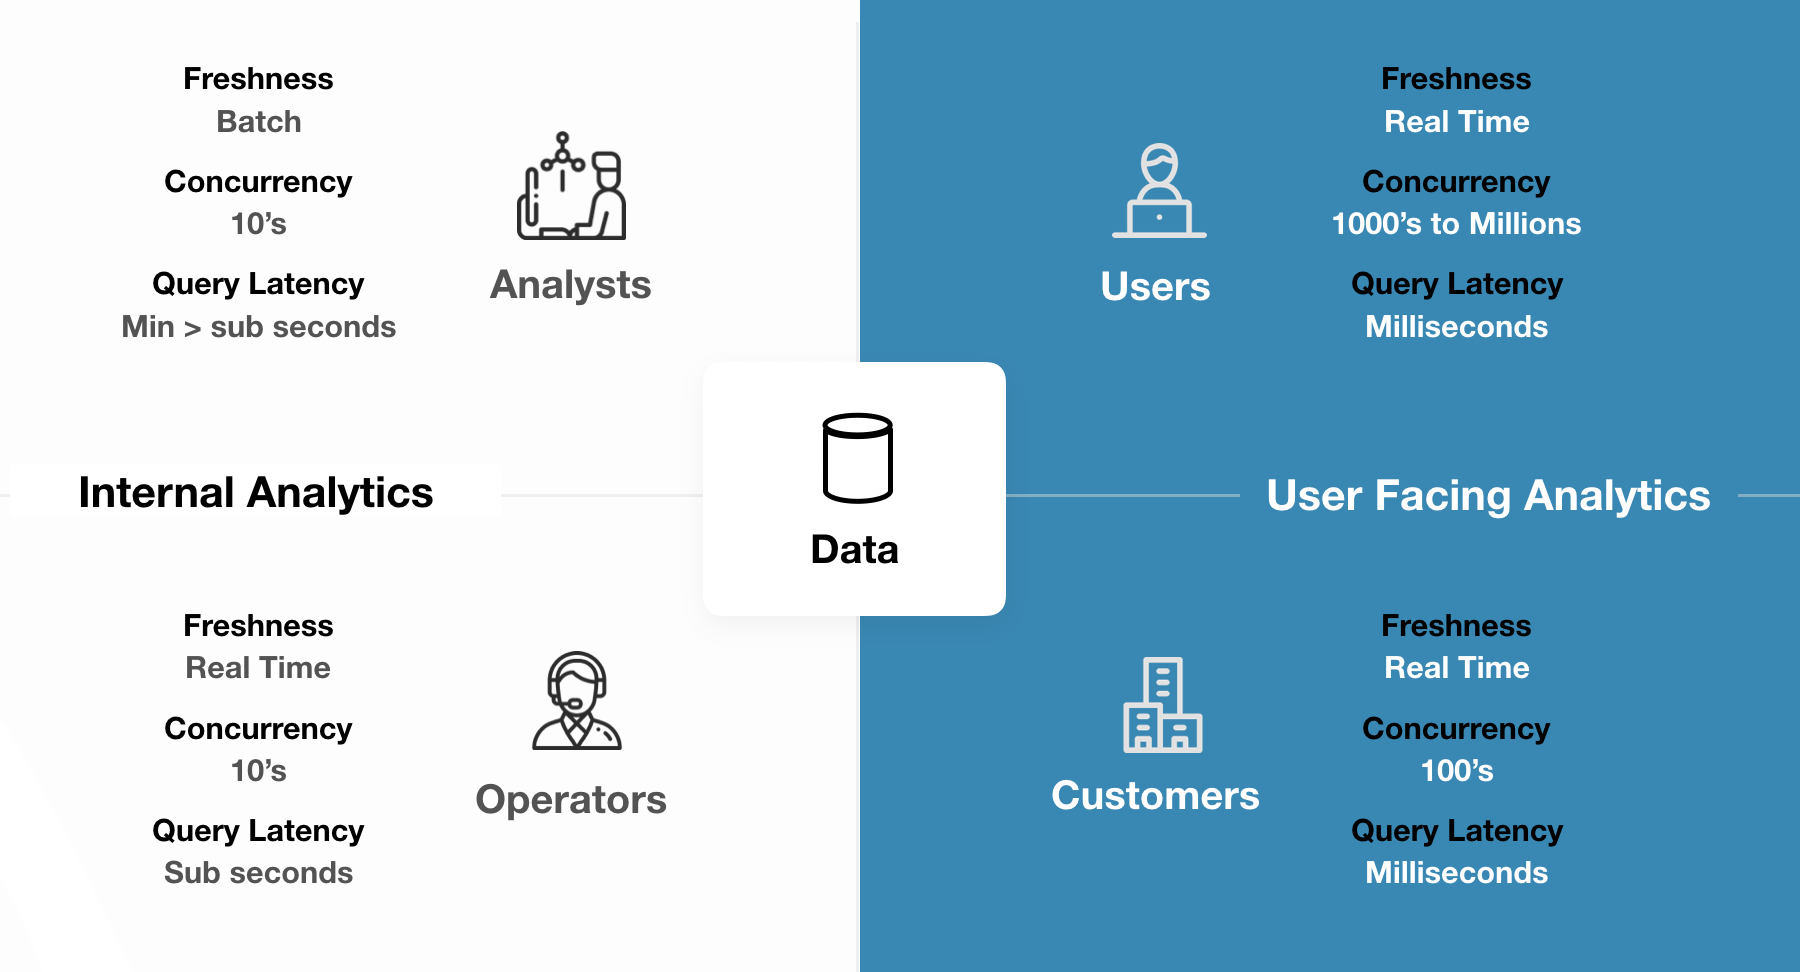
Decision makers need information to make decisions. Traditionally, these have been people internal to organizations—operators and analysts. But people who are technically outside of an organization, but still interacting with it, might want data to make decisions as well.
It should be no surprise that most analytics tools have been built with the first category (internal decision makers) in mind. Think about their profile: There are fewer of them, and they are not all using a system concurrently. Their tolerance for things like query latency is pretty high—if a query takes a few seconds, so be it: It is a part of their job.

The technical needs change, however, when we look at users and customers. (Sometimes users and customers are the same, and sometimes they are not; we provide some examples of each below.) Note how both of these categories differ from internal team members: There are many more of them, they are often connecting concurrently (to the tune of thousands or even millions of connections), and their tolerance for latency is much lower, with data analytics needing to be available in just milliseconds.
The requirements and scale of this second user base is very different, which is why there needs to be a special category of user-facing analytics. Companies that can master this new type of analytics will have a big point of differentiation.
User Data, Users, and Customers: Two Use Cases
Here are two examples where user-facing analytics have a huge payoff if one can get them to scale appropriately.
Consider first a large national or international organization with a potentially distributed and heterogeneous base of analytics users, separate from its customers—a franchise chain of convenience stores would be an ideal example. From the point of view of the organization, the “user” here might be the various franchise operators. Those operators want access to data about their customer base, as well as trends that might be affecting sales and ordering. The franchise organization has tons of customer data, collected from each franchise location with each sale.
Imagine what the users here (read: franchise operators) could learn if they had access to the right kinds of analytics based on that customer data:
- What kinds of products to stock during upcoming events affect sales (holidays, sporting events, etc.)
- When promotions are needed to help drive in-store traffic
- When and why specific problems are occurring (with products, service levels, individual employees, etc.)
- How to price items whose sales velocity has sped up or slowed down
- Other, more traditional customer analytics, such as which demographics are more prone to buying which items, and when
In this case, it is obvious that the analytics are useful to the user: Users get better insights into customer data. But there are also cases where the user might be the customer as well, and that data being aggregated has to do with something else, like engagement.
This was the case with LinkedIn Talent Insights. Talent Insights helps organizations understand the external labor market and their internal workforce, based on information in LinkedIn’s Economic Graph. This allows organizations to make data-driven decisions when it comes to talent acquisition and development. In this case, the users who need access to the data analytics are also LinkedIn’s customers—LinkedIn is providing additional value to its customers by giving them user-facing analytics through Talent Insights. The data itself is based on the behavior of LinkedIn’s 690 million members and their 50 million or so companies and schools.
Other common examples where the user is also the end consumer include fitness wearables (think Fitbit) and product recommendation websites.
What do these cases all have in common, though? First, the number of possible users is high (and thus so is the potential number of concurrent connections to the system). Second, they will need to have access to data that is most useful at any given moment—which means real-time analytics with as low a query latency as possible.
Third, and most importantly for our purposes here, they both represent the value of providing these insights. The insights are not just for the company gathering the data. They are providing insights for the everyday decision-makers in the world. This allows them to offer even more value and gain a competitive advantage.
So What is the True Value of Real-Time, User-Facing Analytics?
The true monetary value of these analytics depends on the specifics of the use case in question, including who the users are and how exactly insights are to be packaged and monetized. In future pieces, we are going to look at some of these use cases in much more detail, while also explaining how we’ve overcome the engineering constraints that have traditionally held back progress with user-facing analytics.
More Resources:
- Join our Slack channel: https://communityinviter.com/apps/apache-pinot/apache-pinot
- See our upcoming events: https://www.meetup.com/apache-pinot
- Follow us on Twitter: https://twitter.com/startreedata
- Subscribe to our YouTube channel: https://www.youtube.com/startreedata