
I recently came across a fascinating blog post written by Simon Aubury that shows how to analyze user activity, server popularity, and language usage on Mastodon, a decentralized social networking platform that has become quite popular in the last six months.
The Existing Solution: Kafka Connect, Parquet, Seaborn and DuckDB
To start, Simon wrote a listener to collect the messages, which he then published into Apache Kafka®. He then wrote a Kafka Connect configuration that consumes messages from Kafka and flushes them after every 1,000 messages into Apache Parquet files stored in an Amazon S3 bucket.
Finally, he queried those Parquet files using DuckDB and created some charts using the Seaborn library, as reflected in the architecture diagram below:
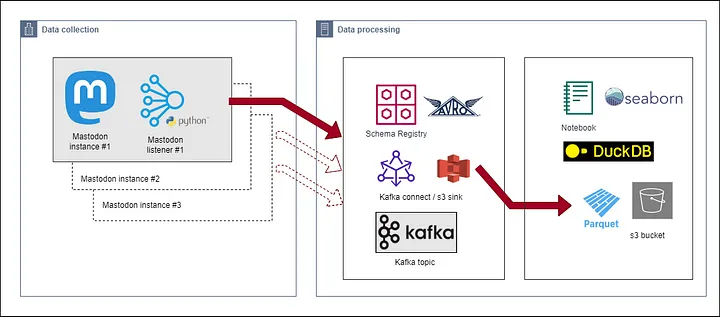
Fig: Data Collection Architecture
The awesome visualizations that Simon created make me wonder whether we can change what happens downstream of Kafka to make our queries even more real-time. Let’s find out!
Going Real-Time with Apache Pinot™
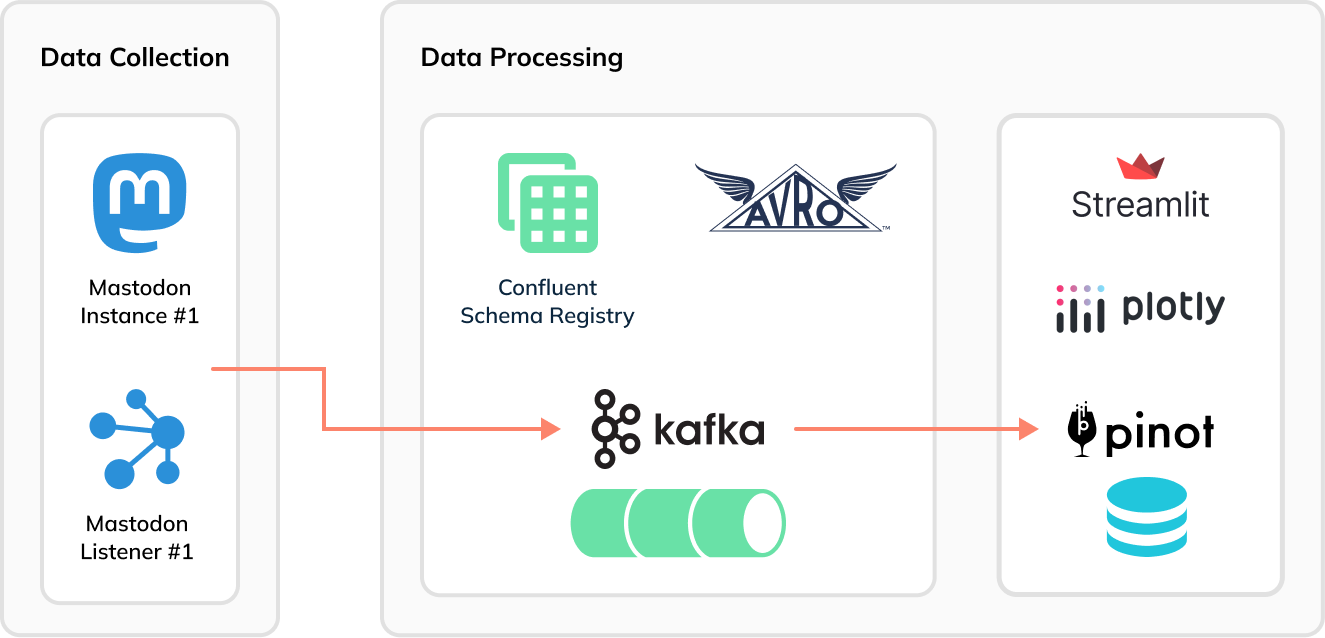
Now Apache Pinot comes into the picture. Instead of using Kafka Connect to batch Mastodon toots into groups of 1,000 messages to generate Parquet files, we can stream the data immediately and directly, toot-by-toot into Pinot and then build a real-time dashboard using Streamlit:
Setup
To follow along, first clone my fork of Simon’s GitHub repository:
git clone [email protected]:mneedham/mastodon-stream.git cd mastodon-streamCode language: PHP (php)Then launch all of the components using Docker Compose:
docker-compose up
Pinot Schema and Table
Similar to what Simon did with DuckDB, we’ll ingest the Mastodon events into a table. Pinot tables have a schema that’s defined in a schema file.
To come up with a schema file, we need to know the structure of the ingested events. For example:
{ "m_id": 110146691030544274, "created_at": 1680705124, "created_at_str": "2023 04 05 15:32:04", "app": "", "url": "https://mastodon.social/@Xingcat/110146690810165414", "base_url": "https://techhub.social", "language": "en", "favourites": 0, "username": "Xingcat", "bot": false, "tags": 0, "characters": 196, "words": 36, "mastodon_text": "Another, “I don’t know what this is yet,” paintings. Many, many layers that look like distressed metal or some sort of rock crosscut. Liking it so far, need to figure out what it’ll wind up being." }Code language: JSON / JSON with Comments (json)Mapping these fields directly to columns is easiest and will result in a schema file that looks like this:
{ "schemaName":"mastodon", "dimensionFieldSpecs":[ {"name":"m_id","dataType":"LONG"}, {"name":"created_at_str","dataType":"STRING"}, {"name":"app","dataType":"STRING"}, {"name":"url","dataType":"STRING"}, {"name":"base_url","dataType":"STRING"}, {"name":"language","dataType":"STRING"}, {"name":"username","dataType":"STRING"}, {"name":"bot","dataType":"BOOLEAN"}, {"name":"mastodon_text","dataType":"STRING"} ], "metricFieldSpecs":[ {"name":"favourites","dataType":"INT"}, {"name":"words","dataType":"INT"}, {"name":"characters","dataType":"INT"}, {"name":"tags","dataType":"INT"} ], "dateTimeFieldSpecs":[ { "name":"created_at", "dataType":"LONG", "format":"1:MILLISECONDS:EPOCH", "granularity":"1:MILLISECONDS" } ] }Code language: JSON / JSON with Comments (json)Next up: our table config, shown below:
{ "tableName": "mastodon", "tableType": "REALTIME", "segmentsConfig": { "timeColumnName": "created_at", "timeType": "MILLISECONDS", "schemaName": "mastodon", "replicasPerPartition": "1" }, "tenants": {}, "tableIndexConfig": { "loadMode": "MMAP", "streamConfigs": { "streamType": "kafka", "stream.kafka.consumer.type": "lowLevel", "stream.kafka.topic.name": "mastodon-topic", "stream.kafka.decoder.class.name": "org.apache.pinot.plugin.inputformat.avro.confluent.KafkaConfluentSchemaRegistryAvroMessageDecoder", "stream.kafka.consumer.factory.class.name": "org.apache.pinot.plugin.stream.kafka20.KafkaConsumerFactory", "stream.kafka.decoder.prop.format": "AVRO", "stream.kafka.decoder.prop.schema.registry.rest.url": "http://schema-registry:8081", "stream.kafka.decoder.prop.schema.registry.schema.name": "mastodon-topic-value", "stream.kafka.broker.list": "broker:9093", "stream.kafka.consumer.prop.auto.offset.reset": "smallest" } }, "metadata": { "customConfigs": {} }, "routing": { "instanceSelectorType": "strictReplicaGroup" } }Code language: JSON / JSON with Comments (json)The following configs represent the most important ones for ingesting Apache Avro™ messages into Pinot:
"stream.kafka.decoder.class.name": "org.apache.pinot.plugin.inputformat.avro.confluent.KafkaConfluentSchemaRegistryAvroMessageDecoder", "stream.kafka.decoder.prop.format": "AVRO", "stream.kafka.decoder.prop.schema.registry.rest.url": "http://schema-registry:8081", "stream.kafka.decoder.prop.schema.registry.schema.name": "mastodon-topic-value",Code language: JavaScript (javascript)The KafkaConfluentSchemaRegistryAvroMessageDecoder decoder calls the Schema Registry with the schema name to get back the schema that it will use to decode messages.
We can create the Pinot table by running the following command:
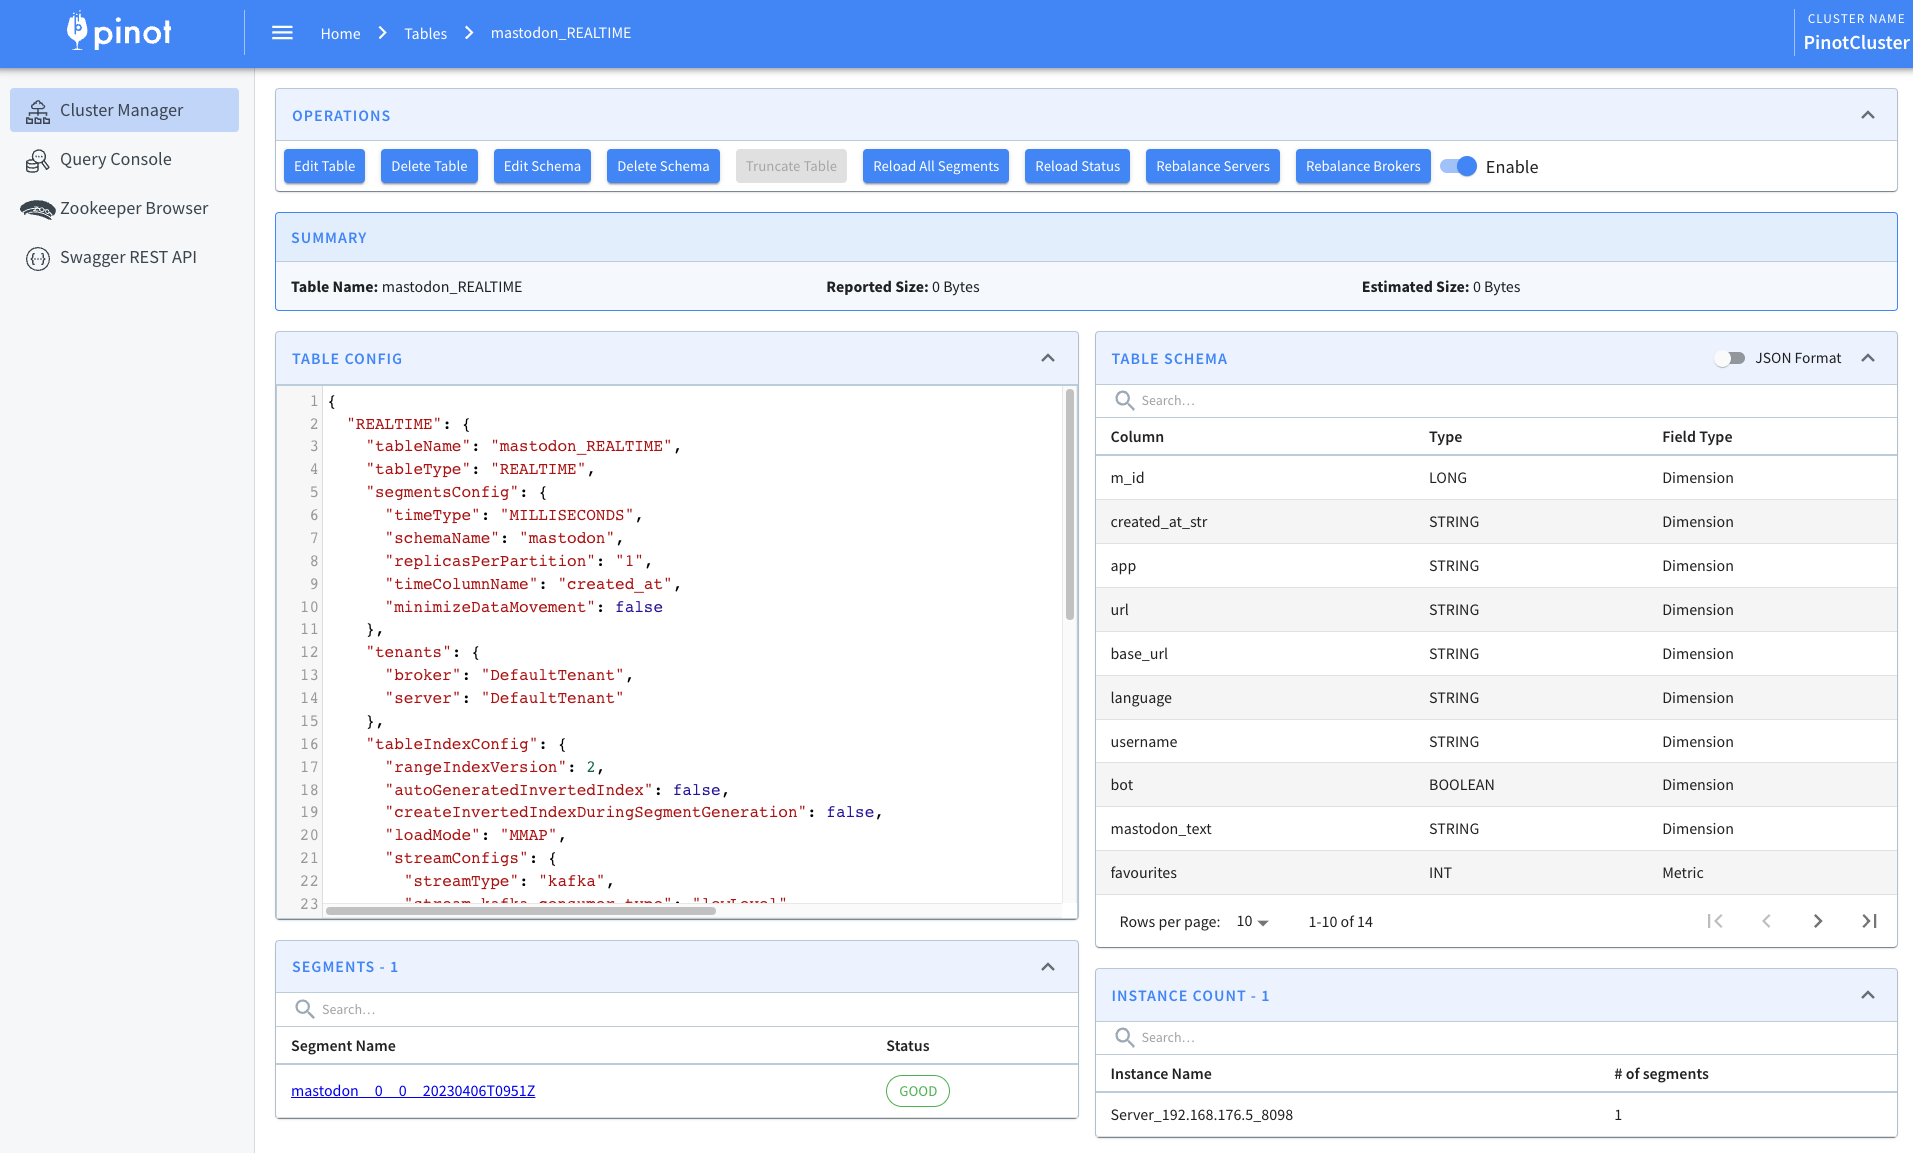
docker run --network mastodon -v $PWD/pinot:/config apachepinot/pinot:0.12.0-arm64 AddTable -schemaFile /config/schema.json -tableConfigFile /config/table.json -controllerHost "pinot-controller" -execCode language: JavaScript (javascript)We can then navigate to the table page of the Pinot UI:
Here, we’ll see the following:
Ingest Data into Kafka
Now, we need to start ingesting data into Kafka. Simon created a script that accomplishes this for us, so we just need to indicate which Mastodon servers to query.
python mastodonlisten.py --baseURL https://data-folks.masto.host --public --enableKafka --quiet python mastodonlisten.py --baseURL https://fosstodon.org/ --public --enableKafka --quiet python mastodonlisten.py --baseURL https://mstdn.social/ --public --enableKafka --quietCode language: JavaScript (javascript)We can then check the ingestion of messages with the kcat command line tool:
kcat -C -b localhost:9092 -t mastodon-topic -s value=avro -r http://localhost:8081 -eCode language: JavaScript (javascript)Query Pinot
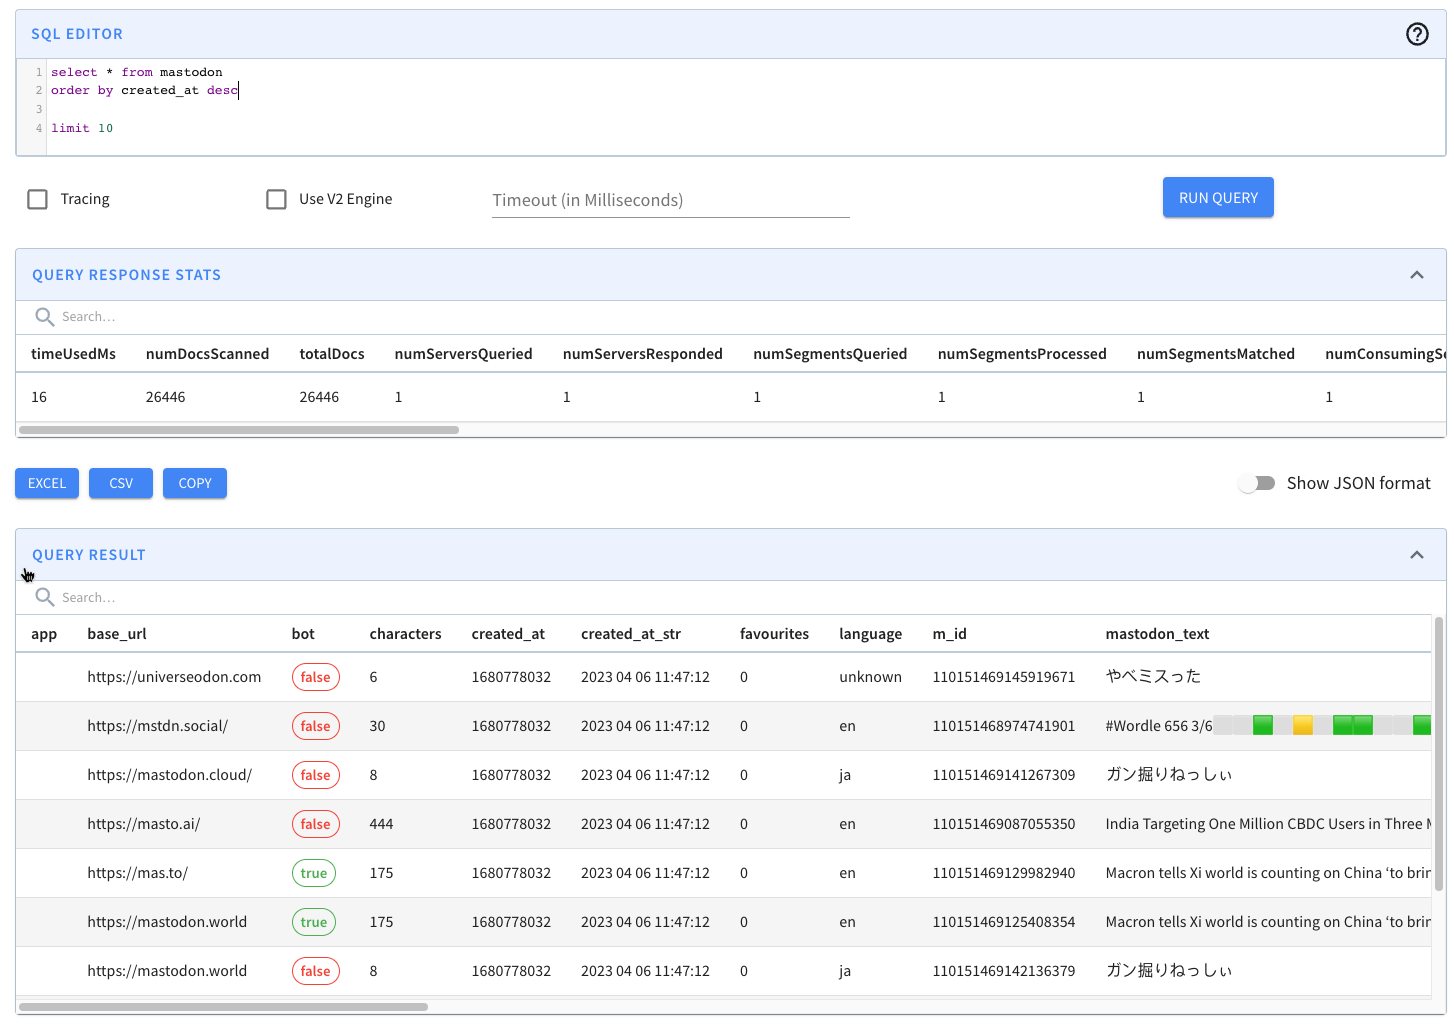
Now, let’s go to the Pinot UI to see what data we’ve got to play with:
We’ll see the following preview of the data in the mastodon table:
We can then write a query to find the number of messages posted in the last five minutes:
select count(*) as "Num toots" , count(distinct(username)) as "Num users" , count(distinct(url)) as "Num urls" from mastodon where created_at*1000 > ago('PT1M') order by 1 DESC;Code language: JavaScript (javascript)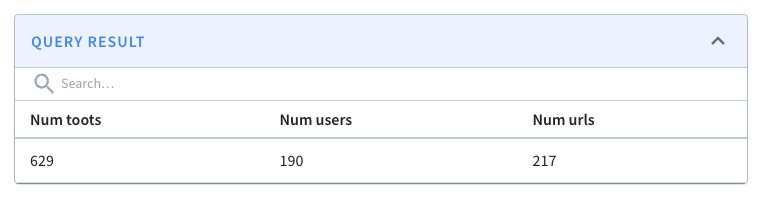
We can also query Pinot via the Python client, which we can install by running the following:
pip install pinotdb
Once we’ve done that, let’s open the Python REPL and run the following code:
from pinotdb import connect import pandas as pd conn = connect(host='localhost', port=8099, path='/query/sql', scheme='http') curs = conn.cursor() st.header("Daily Mastodon Usage") query = """ select count(*) as "Num toots" , count(distinct(username)) as "Num users" , count(distinct(url)) as "Num urls" from mastodon where created_at*1000 > ago('PT1M') order by 1 DESC; """ curs.execute(query) df = pd.DataFrame(curs, columns=[item[0] for item in curs.description])Code language: JavaScript (javascript)This produces the resulting DataFrame:
Num toots Num users Num urls 0 552 173 192Streamlit
Next, we’ll create a Streamlit dashboard to package up these queries. We’ll visualize the results using Plotly, which you can install using:
pip install streamlit plotly
I’ve created a Streamlit app in the file app.py, which you can find in the GitHub repository. Let’s have a look at the kinds of visualizations that we can generate.
First, we’ll create metrics to show the number of toots, users, and URLs in the last n minutes. n will be configurable from the app as shown in the screenshot below:
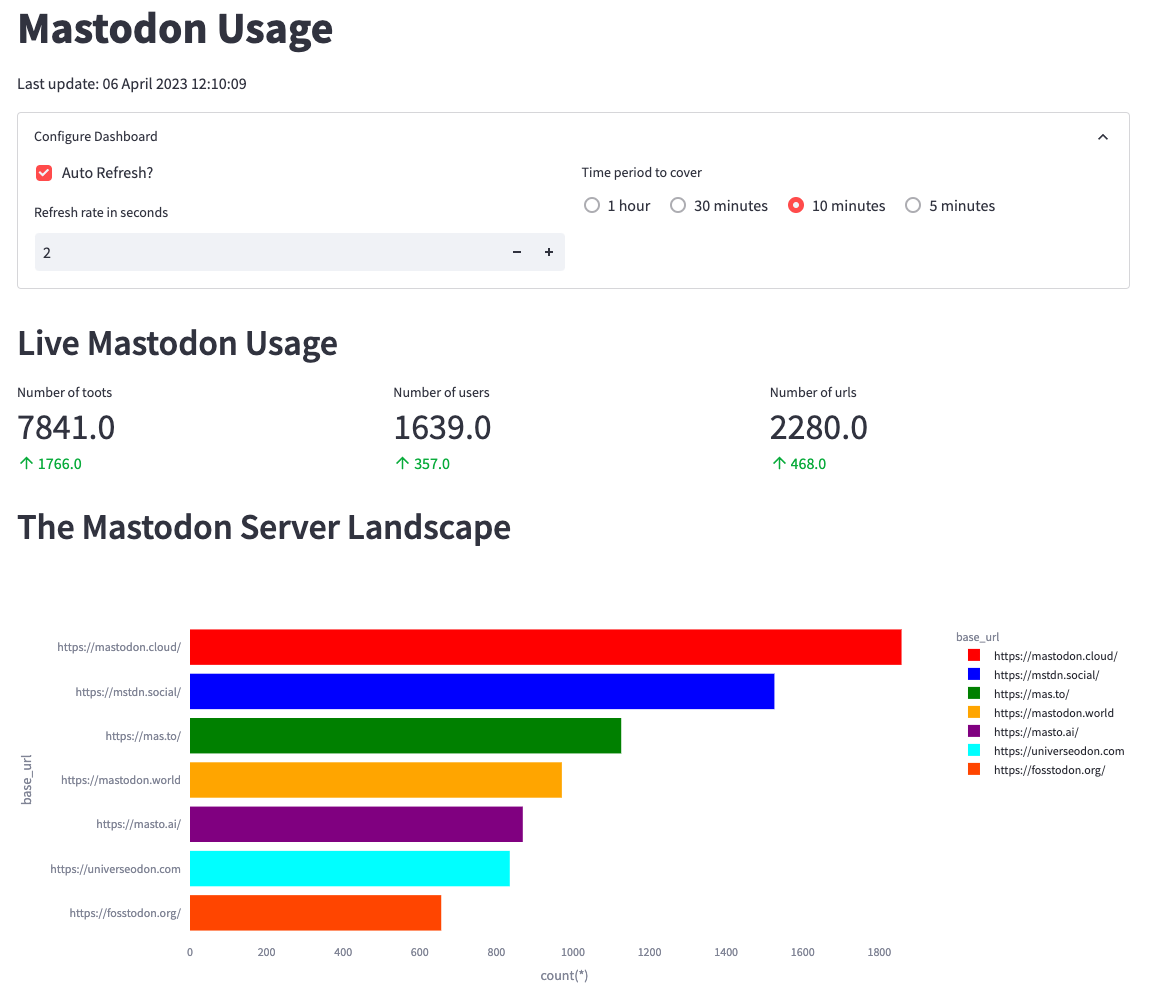
From the screenshot, we can identify mastodon.cloud as the most active server, though it produces only 1,800 messages in 10 minutes or three messages per second. The values in green indicate the change in values compared to the previous 10 minutes.
We can also create a chart showing the number of messages per minute for the last 10 minutes:
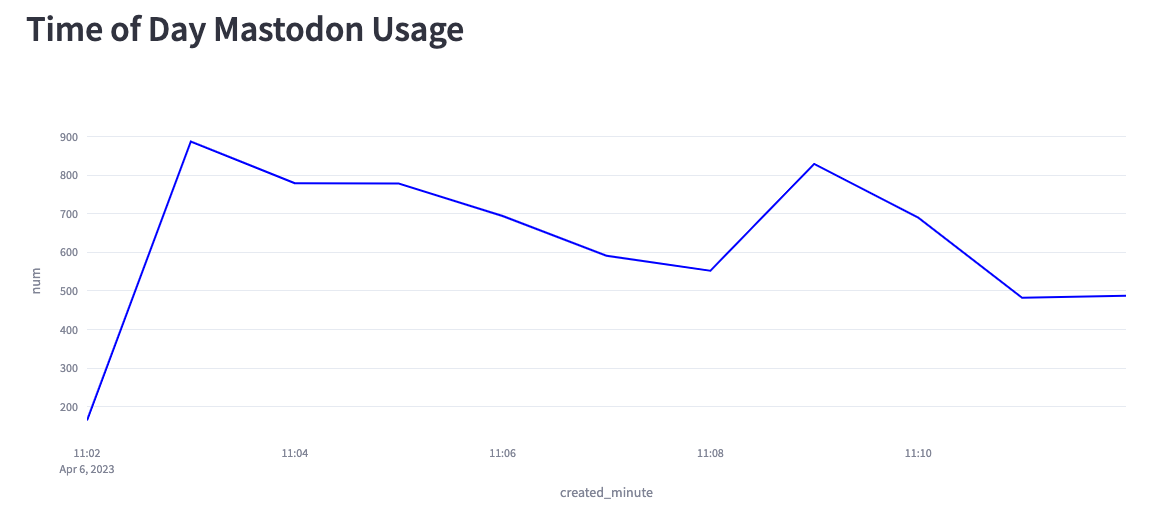
Based on this chart, we can see that we’re creating anywhere from 200–900 messages per second. Part of the reason lies in the fact that the Mastodon servers sometimes disconnect our listener, and at the moment, I have to manually reconnect.
Finally, we can look at the toot length by language:
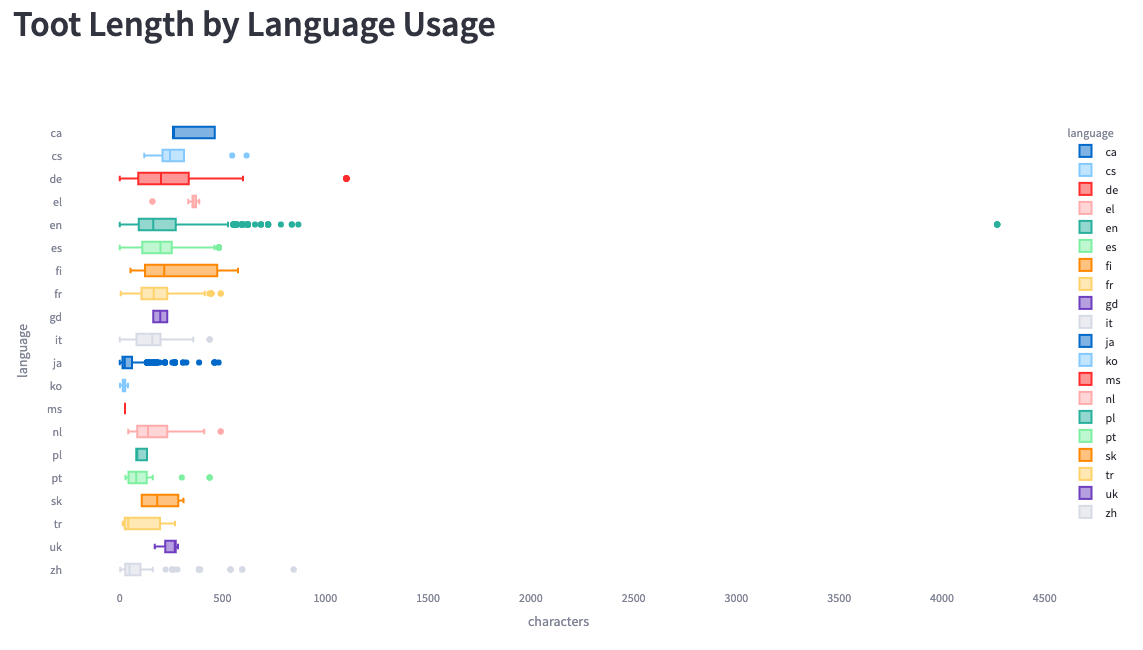
We see much bigger ranges here than Simon saw in his analysis. He saw a maximum length of 200 characters, whereas we see some messages of up to 4,200 characters.
Summary
We hope you enjoyed following along as we explored this fun use case for real-time analytics. As you can see, even though we’re pulling the data from many of the popular Mastodon servers, it’s still not all that much data!
Give the code a try and let us know how it goes. If you have any questions, feel free to join us on Slack, where we’ll gladly do our best to help you out.