This Halloween we shared horror stories we’ve experienced or heard of others experiencing in the world of big data and real-time analytics. Let’s go over a few horror stories, and also teach you how to fight back against some of these monsters.
First, to set the stage, let’s talk a little about real-time analytics. Here we mean systems capable of providing query results in subsecond to, at most, single-digit second latencies. The kind of responsiveness that can drive a mobile app, a web page, or an application in such a way that a typical user would perceive little or no delay. Plus, given the scale of user bases being in the millions these days, query concurrency needs to be able to scale throughout the day — a concept we refer to as user-facing analytics.
Watch the full video
This blog is based on an online meetup held on Halloween this year. Watch it in full:
Chapter 1: Unnatural acts
The first kind of horror story you can encounter is an “unnatural act” — when you use a tool that is familiar, comfortable, practically nostalgic — but there’s something off. Like that small town at the start of the horror story. Everything seems natural. However, when you try to use that tool for real-time analytics — a task it was never designed to handle — it becomes a monster! The idyllic small town becomes a hellish landscape.
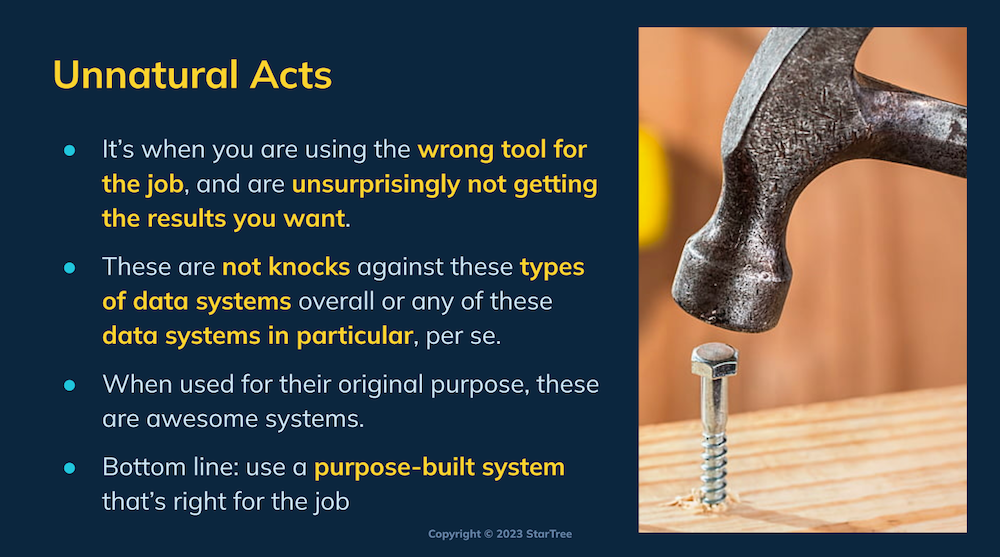
When you use the wrong tool for the job, you’re not likely to get the results you want. This is not a knock against a specific tool when used for its original intended purpose. It’s all a matter of form-fits-function, and using a purpose-built system that’s right for the job.
Real-time OLTP ≠ Real-time OLAP
Within the category of unnatural acts, the first grievous sin committed by organizations is when they take a perfectly good Online Transactional Processing (OLTP) oriented database and applying it to Online Analytical Processing (OLAP) workloads.
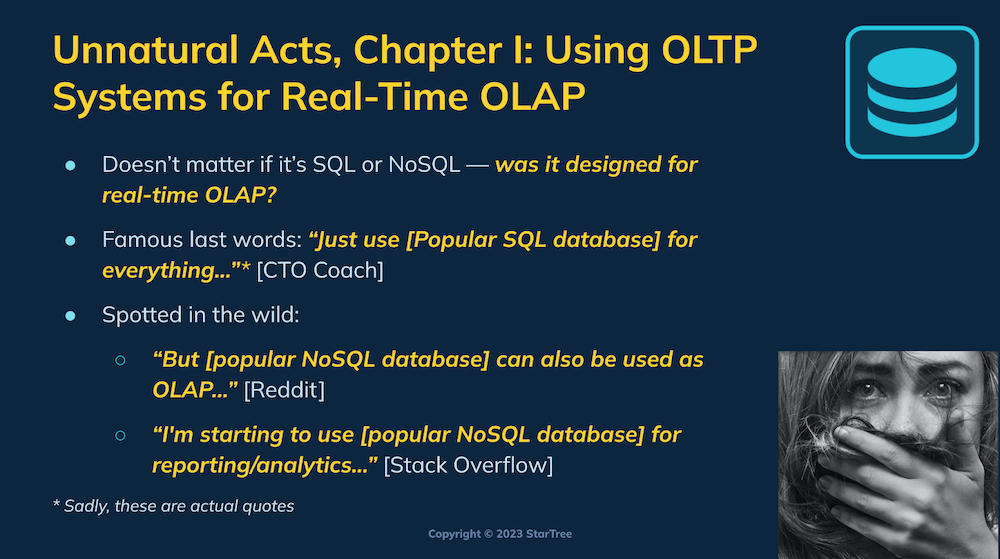
While you might be able to get away with platooning your favorite OLTP database for OLAP use cases to a certain scale, once you hit that scale, you’ll hit a wall. Maybe it’s when you grow from gigabytes to terabytes of data. Or maybe it’s when you go from a few QPS to hundreds or thousands of QPS. Or maybe when drill-down queries and aggregations get increasingly complex.
It doesn’t matter if it’s SQL or NoSQL — it’s a matter of architecture. The vast majority of OLTP systems were designed as row-based stores; they lack the column store format and optimizations required for large range and full table scans, plus the fast aggregations required by analytical use cases.
As one data scientist observed, one popular NoSQL database used for analytics “does work… until it doesn’t.” He went on to explain, “I had to become an expert in querying and aggregating data… management didn’t want to change, and sooner rather than later it was too complex for no reason.”
Search engine ≠ Real-time OLAP
The next unnatural act is when people overload their search engines with analytical use cases. People love the freedom and flexibility of full text searches with regular expressions. Yet in case after case, when users begin to throw on real-time analytics — use cases heavy on aggregations — suddenly the search engine architecture becomes a liability.
In a talk given by Uber, they discussed how their favorite search engine became increasingly unreliable and memory-intensive. While they could continue to throw 20 to 30 more nodes at the problem, they were also suffering minor data loss and an increasingly expensive monthly bill.
By moving to a designed-for-purpose real-time analytics database, they saw costs shrink, while also seeing their reliability and performance improve to meet their expectations and demands.
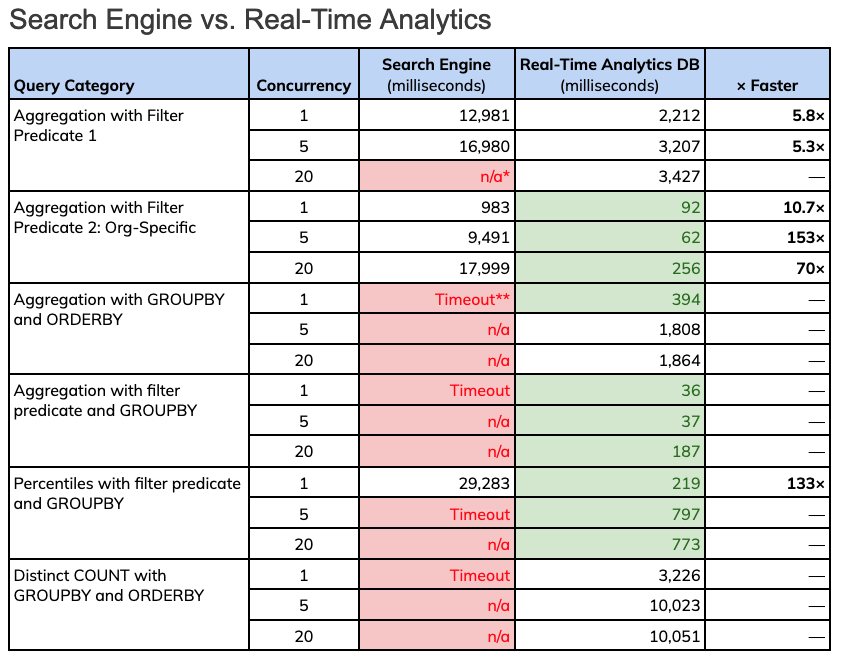
Red indicates timeouts or tests not run. Green indicates sub-second query results.
* Tests not run due to bad performance at a lower concurrency or related category
** Timeouts were set at 30 seconds; if a prior test timed out, user chose not to test at higher concurrencies.
Key takeaways from the table above:
- Search engine timed out in 67% of cases (>30s)
- Search engine only had 1 case of subsecond latencies (barely: 983 ms)
- Real-time analytics database (Apache Pinot) gave <1s p99 latencies in 10 out of 18 cases , and little as 37 milliseconds
- Real-time analytics database took 10 seconds at most; never timed out
In a similar talk from Cisco WebEx, they saw a 10× reduction in storage, and reduced query latencies between 5× to 150×. In two thirds of tested cases, their search engine solution would timeout (>30 seconds). Whereas using a real-time analytics database like Apache Pinot saw all their queries return well within the timeout window, with the majority of tested cases resulting in subsecond latencies.
Data warehouse ≠ Real-time OLAP
While data warehouses are awesome repositories in terms of scale and complexity of data they can manage, they are not going to produce results in anything really approaching “real-time.” For example, in a recent comparison a data warehouse product was able to produce results in a scale of 1-5 minutes time. That’s simply too long for your typical mobile or web application — users would think the app was broken. Whereas a real-time analytics database can produce results with single-digit seconds to milliseconds scale latencies. Anywhere from 37× to 19200× faster, depending on the complexity of the query.
Beyond this, data warehouses are designed for internal audiences, where the number of concurrent queries is relatively small and the reports being generated are relatively fixed. For external user-facing analytics, you are going to run into far greater QPS and with less predictive sudden bursts of requests.
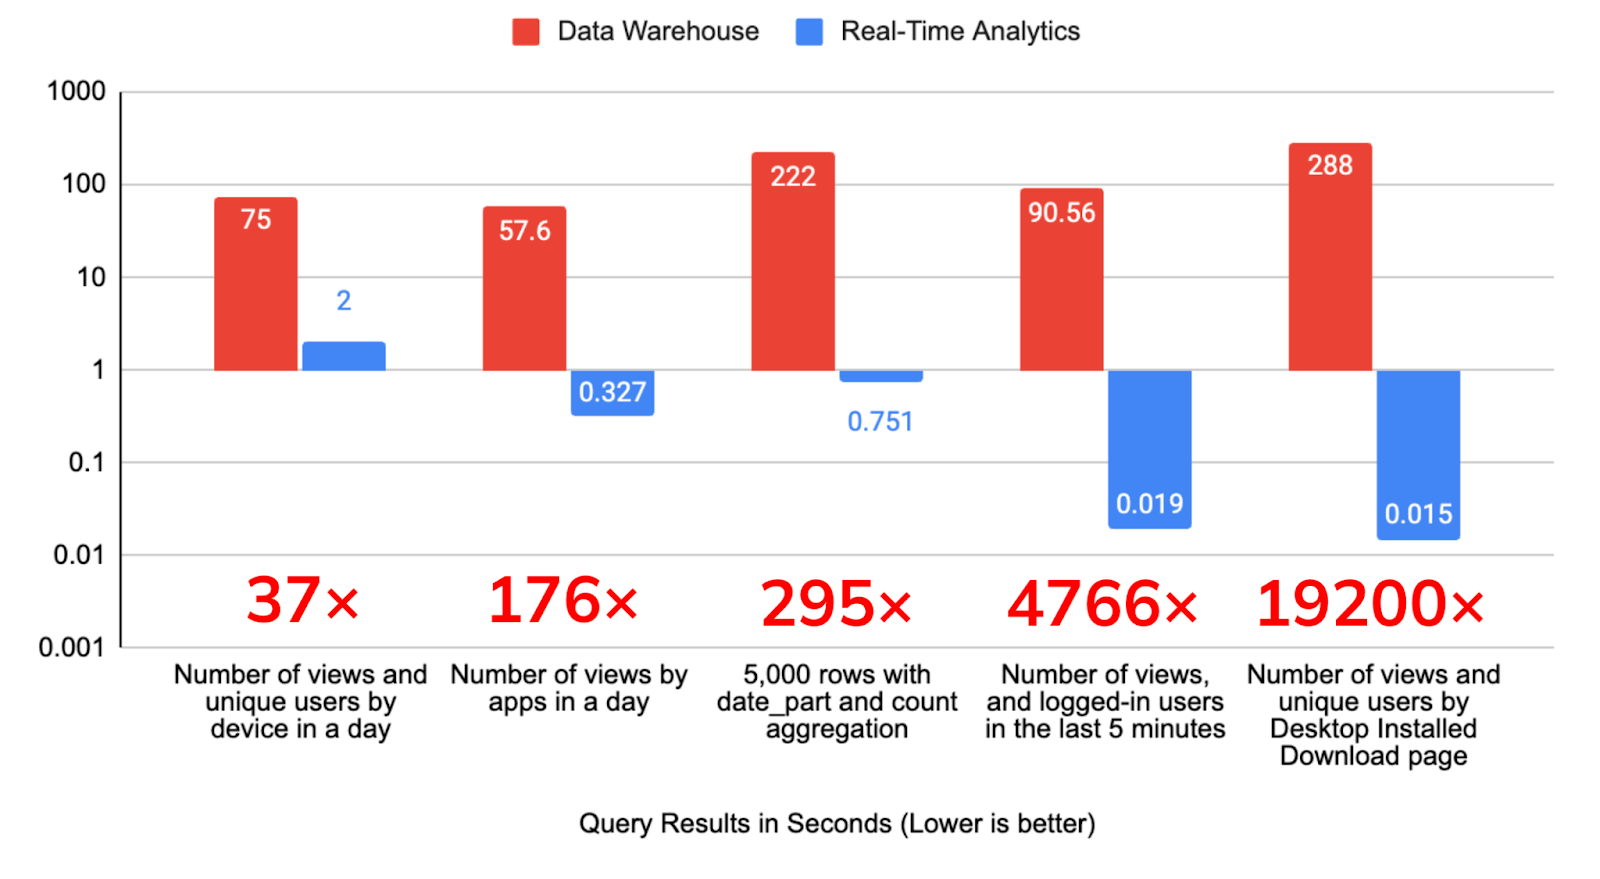
Key takeaways from the chart above:
- The data warehouse took between 1-5 minutes for results
- The real-time analytics database (Apache Pinot) was able to produce results in 2 seconds at most, and in as little as 15 milliseconds.
If you have an exabyte of data or don’t mind if results return in minutes or even hours, that sounds like a job for a data warehouse. Yet if you are trying to produce results for applications designed with impatience economy in mind, and with data in the terabyte to petabyte scale, designed to serve results to thousands or even millions of users, then a real-time, user-facing analytics solution would serve you best.
Bottom line: Use the right tools for the job
If you were going to hunt vampires, you’d get some wooden stakes and a mallet. Maybe some other accoutrements like holy water and holy symbols in a kit. If you were hunting werewolves, you’d be sure to bring along trusty silver bullets. Nothing else would be able to handle those monsters. So when you need to tackle monstrously huge data, to handle massive queries with low latencies, you’d get yourself a handy real-time analytics database, like Apache Pinot. It’s the right tool for the right job.

Chapter 2: True tales of terror — in production!
The next class of horror stories has to do with situational issues that arise when running real-time systems in production. These kinds of issues can arise in many types of big data systems; they are not limited to real-time analytics per se. Yet if they do occur in your real-time analytics systems, they will be noticed immediately. It’s not like you have a four-hour report window to fix the problem, or only have to worry about internal stakeholders getting reports late. When it’s real-time, user-facing analytics, your entire user base will suddenly notice when information and updates fail to arrive in seconds.
Ad hoc query chaos
When you let anyone in an organization make ad hoc queries, sometimes you can get runaway queries. First, your system needs to have observability built into it in order to detect what’s driving up data loads in your systems. For example, query metric logging to determine what queries are causing problems.
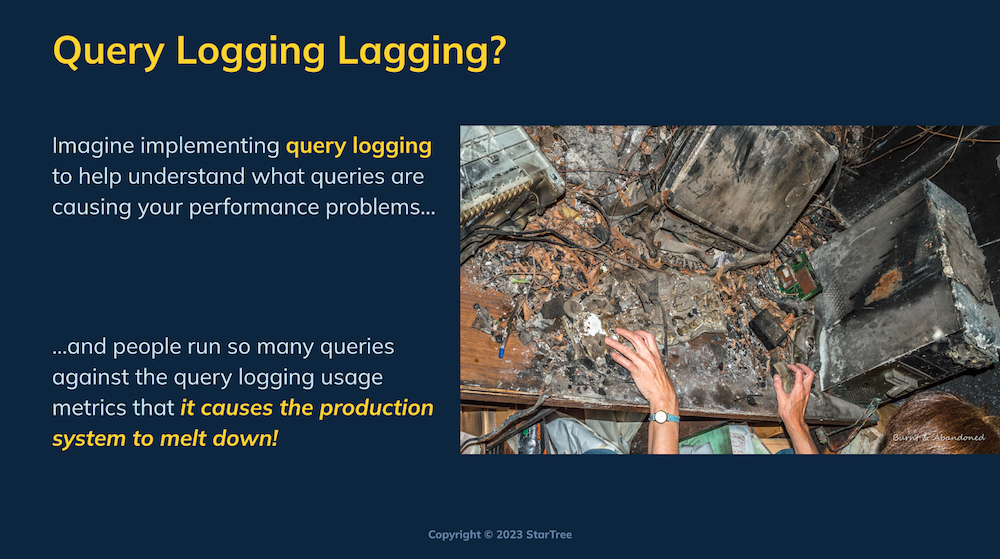
Just detecting problematic errors, by itself, is also insufficient. You need to be able to manually or automatically take problematic queries and kill them gracefully. Fortunately, Apache Pinot has automatic query killing to protect from out-of-memory (OOM) conditions. However, what if your query metric logging is such a popular diagnostic tool that people hammer it constantly, thus driving up the load by itself? How do you shed load on the tool that’s being used to determine how to shed load? It seems ironic, but it’s actually happened before.
Disaster recovery disasters
What if you realize that all of your tables were deleted — and your vendor tells you that you have no backup? Or what if you have a datacenter fire, and all of the backups were kept at the same datacenter?
Datacenter fires are not as rare of an issue as you might think. There were 21 datacenter fires (or explosions) around the world since 2014. In 2023 alone, there have been 6 datacenter fires so far! In fact, one datacenter fire knocked out emergency services. (Just imagine the terror of not being able to call the fire department to put out the fire at the datacenter!)
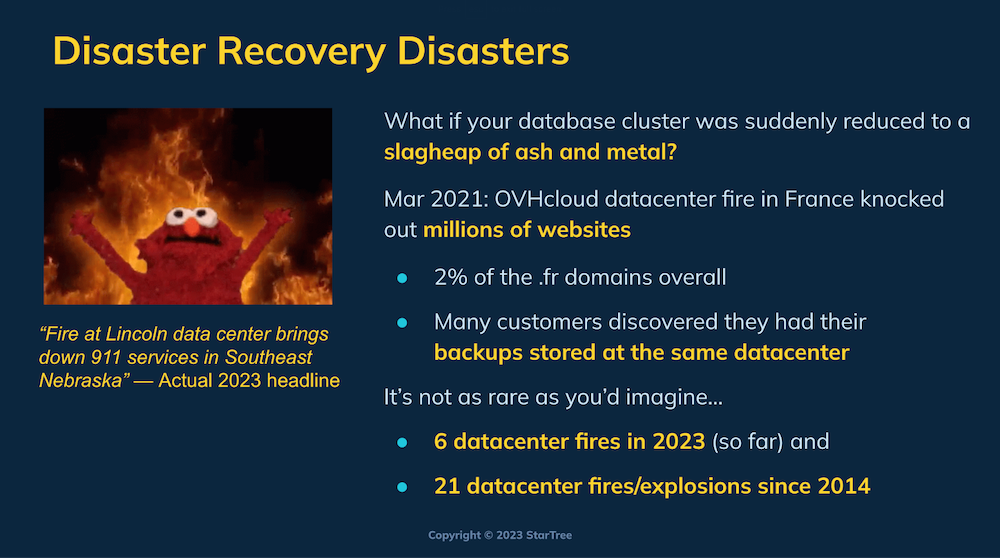
While neither you, nor your analytics database vendor are responsible for datacenter fires, per se, you need to have contingency plans and playbooks to deal with them regardless.
Unfettered access to prod
While some companies laud the ability to “move fast and break things,” in many business-critical use cases you don’t have that luxury. You also don’t get the luxury of determining when that unfettered access will come back to haunt you, resulting in a real-time crisis. Organizationally it could result in data loss, revenue loss or other real-world ramifications. Personally, it could cost you evenings, weekends, ruined travel plans, not to mention the loss of hair or stomach lining.
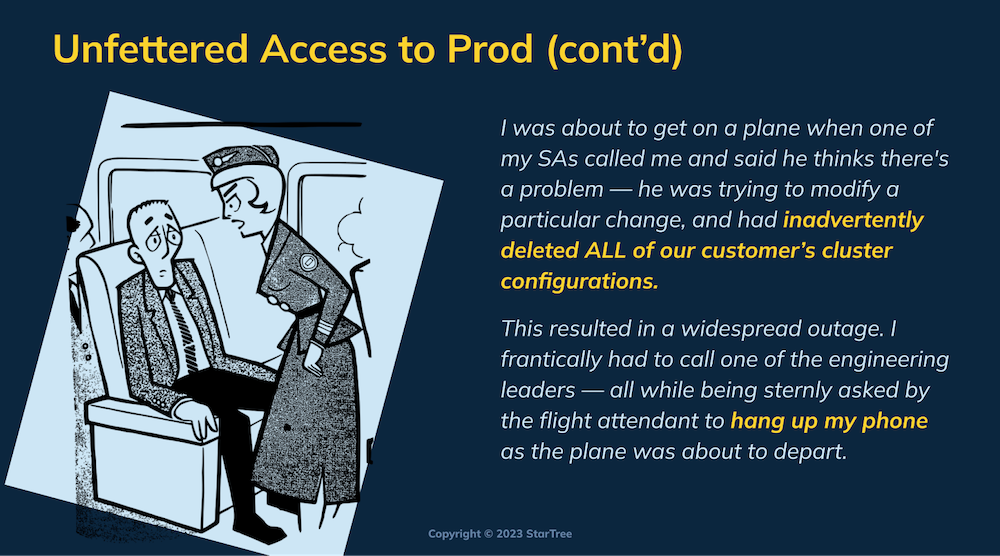
The way to prevent this is to build proper tools that still allow users to do what they need to do, yet may isolate changes, automate processes and generally make mistakes far less likely.
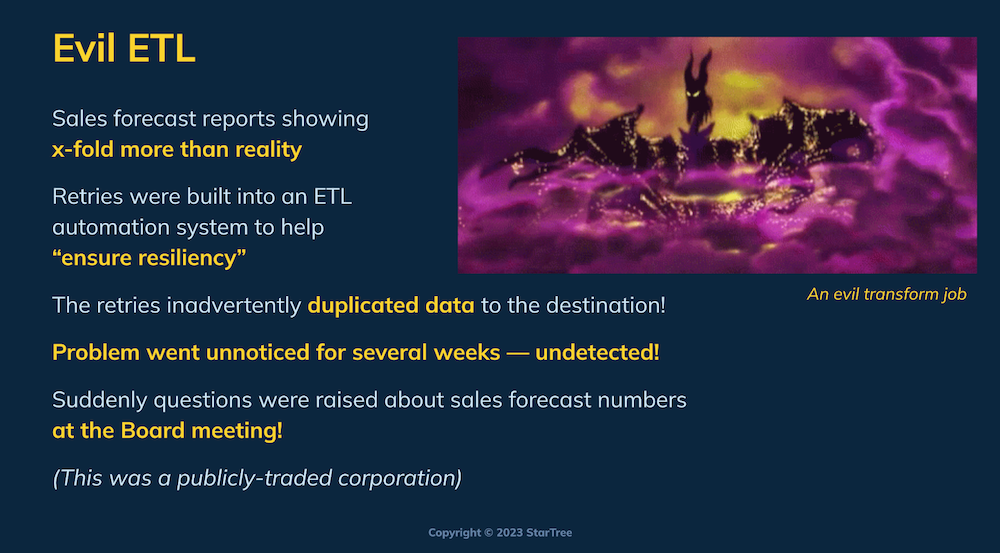
Evil ETL
There are many, many horror stories with ETL and data pipelines. In one particular case, an automated ETL pipeline process implemented to “ensure reliability” actually inadvertently duplicated sales data. This skewed results and wasn’t caught until the issue got all the way to board-level visibility. Fortunately for this publicly-traded company, the problem was caught before any public disclosures or statements!
Before you find yourself in this situation, check if your analytics system supports methods for deduplication.
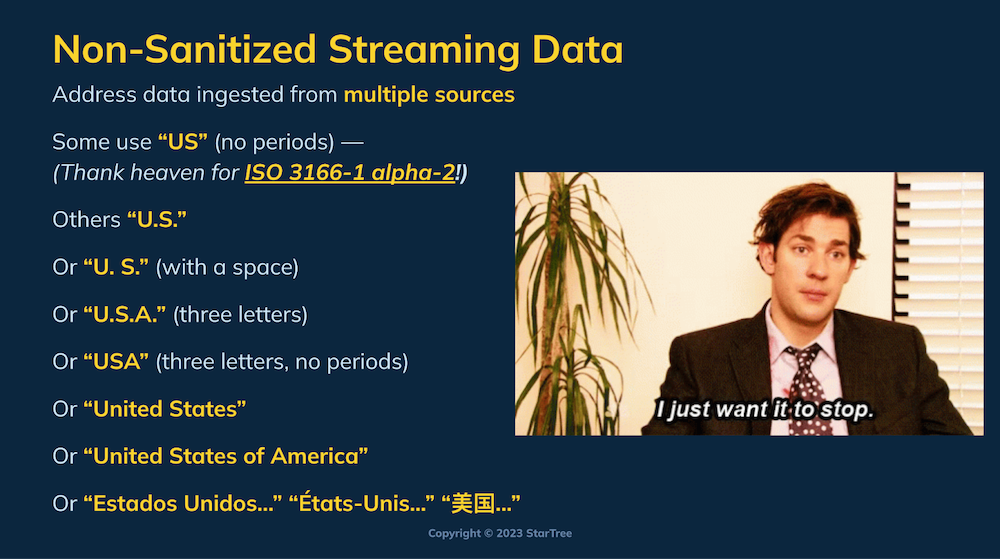
At the same time, with modern data systems you are often ingesting data from across the enterprise and even between enterprises at the rate of millions of objects per second. There’s no guarantee your data is sanitized across all sources. Plus, even if you become intimately familiar with those data feeds prior to ingestion, they are often subject to change without notice.
Just imagine something as simple as “country code.” Hopefully most of your apps will provide country in ISO 3166-1 alpha-2 format — two letters, no periods. But what if somewhere across the data landscape some app is providing literal strings that could be abbreviations with periods, e.g., “U.S.,” while others are using fully-spelled out names, like “United States of America?” Any number of variations are possible: “U.S.A.” or “USA”. Or what if you are also ingesting data in foreign language formats, such as “Estados Unidos,” Étas-Unis,” or “美国?” At a million objects per second, you quickly end up with a non-sanitized mess. Dirty data turns you from a data engineer into a data janitor.
Cloud costs
Entire semesters-long courses could be written consisting solely of horror stories related to cloud cost overruns. Back in 2021, a survey by Pepperdata found that a third of businesses saw their cloud budgets were exceeded by 20% to 40%; one in twelve saw costs rising even higher than 40%. Cloud cost containment remains one of the biggest problems in the industry, which has spurred on new titles such as “cloud economist” to deal with the issue.

However, that is often more the case for transient server clusters, such as Spark jobs. After those are run, the clusters should have been decommissioned. For state-based systems like persistent databases, a different but prevalent problem is that users haven’t optimized their clusters for their workloads. Perhaps they overprovisioned during the initial scoping of the project, or anticipated growth and new workloads never materialized. Whenever discovered, teams should work with their vendors to see how they can tailor their provisioning and optimize their spend.
Have horror stories of your own?
This is obviously just a brief overview of some of the many categories of horror stories you can encounter in real-time analytics. Watch the full video for more tips and tricks! We’d also love to hear any of your own. And Book a demo to see how StarTree Cloud, powered by Apache Pinot, might help you handle some of the horror stories you face in your day-to-day world.