
In today’s data-driven landscape, anomaly detection in real-time metrics monitoring has emerged as a paramount concern for businesses. Whether you’re monitoring website traffic, keeping tabs on IoT device telemetry, or safeguarding financial transactions, the ability to detect anomalies proactively is the foundation for smooth operations and protection against unforeseen threats.
Understanding the anomaly detection landscape
Anomaly detection identifies unusual data patterns that are critical for industries such as IT, finance, healthcare, and manufacturing. It detects issues that fall out of regular business patterns and shows you the exceptions that you may need to pay critical attention to. Issues like fraud, security breaches, equipment failures, and operational inefficiencies.
There are three main types of anomaly detection models if we group them by their algorithmic underpinnings:
- Rules-based — Simple threshold parameters; fast but limited in complex cases
- Data sciences–based — Methods like statistics and linear algebra, but shy of Machine Learning. Customizable but more resource-intensive
- Machine learning (ML)–based — Powerful but complex; even more resource intensive
Each of these have its own advantages and disadvantages. With various different anomaly detection techniques available, which one is right for your organization and use case? Let’s take a bit more time to break these down to compare them.
Rules-based systems
A rules-based system uses simple parametric threshold modeling:
- Triggers an anomaly based on a simple algorithm, such as if a parameter matches, exceeds, or falls below a specific value (i.e., basic equality or inequality operators: =, <, >, ≤ or ≥).
- Analyses current data given no prior historical context
- Fast to set up; doesn’t require ingesting historical data
- Is a given data point above or below a certain threshold? (i.e., was a temperature reading too high or low for normal tolerances?)
- Did too many events occur in quick succession? (Possibly indicative of a systemic problem.)
- Or were there not enough events recorded over a certain period? (Imagine when a machine fails to provide a regular keepalive signal.)
Parametric rules-based systems are usually straightforward enough for someone in your data, platform, or operations team to establish and adjust as needed. Such rules for triggers and alarms are mathematically simple to create, mostly relying on “greater than” or “less than” logic. However, they are static and do not consider situational logic. Consider instead a statistical-based system.
For example, consider the following graph:
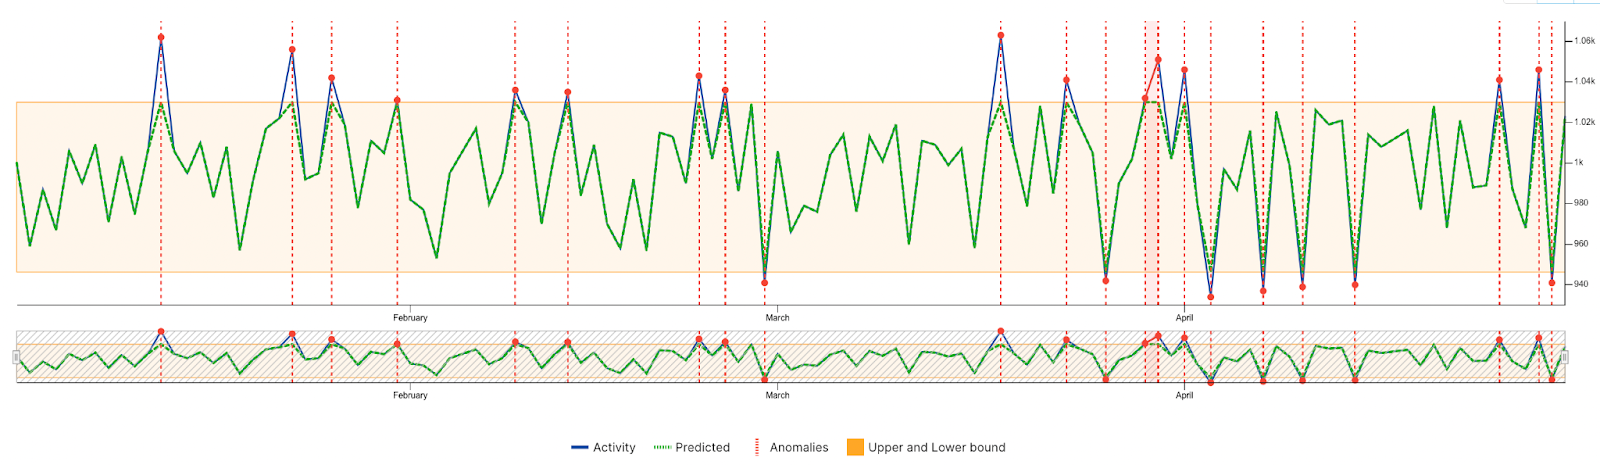
In this hypothetical example, an ideal range for this metric is roughly between 950 and 1030. Anything above or below that set range is marked as an anomaly. However, while conceptually simple and appropriate for many use cases, these basic rules do not account for historical trends.
Data sciences – based systems
A data sciences–based system uses more complex understandings of data, adjusting the parametric model over time-based on more advanced statistical and linear algebra models:
- Combines insights from both real-time and historical data.
- Adjusts thresholds based on past patterns of behavior: daily, weekly, monthly, and annually. (e.g., it is usual and expected to get far more orders during lunchtime than late at night or over a weekend; another example might be the uptick in traffic in the lead-up to Christmas.)
- Uses common statistical models such as percentile and interquartile range (IQR) methods.
- May also use basic data science models such as k-means clustering or density-based spatial clustering of applications with noise (DBSCAN).
Such systems integrate real-time data with historical data. For example, Apache Pinot allows for hybrid tables, allowing live data streams from, say, Apache Kafka topics to seamlessly integrate with data uploaded from your data warehouse or a cloud object store such as S3. Data is immediately available for querying.
Consider this example:
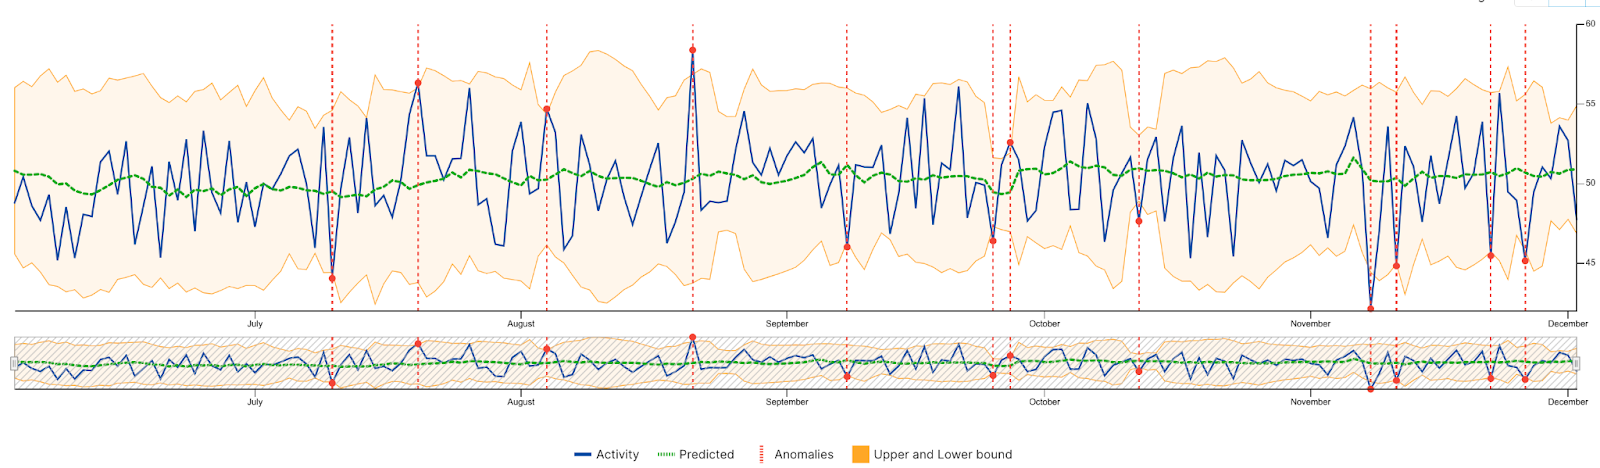
The Interquartile Range (IQR) for historical data (area shaded in tan) is compared to the current year (solid blue line). The mean average for results is represented by the green line. Note the IQR and mean fluctuates depending on the time of year (seasonality). The current year’s results only register as anomalies when values fall outside of the IQR. This allows for a more sophisticated measurement of whether data is truly an anomaly, or whether it falls within bounds of historical trends.
While you do not need someone on your team with data science experience to operate such a system, your team would greatly benefit from having data science knowledge to employ more complex statistical methods.
Machine learning – based systems
An ML-based system often employs far more sophisticated data science methods, such as:
- Supervised and unsupervised training
- Vector analytics
- Graph analytics
- Long short-term memory (LSTM)
- Confidence learning, and/or
- Deep learning
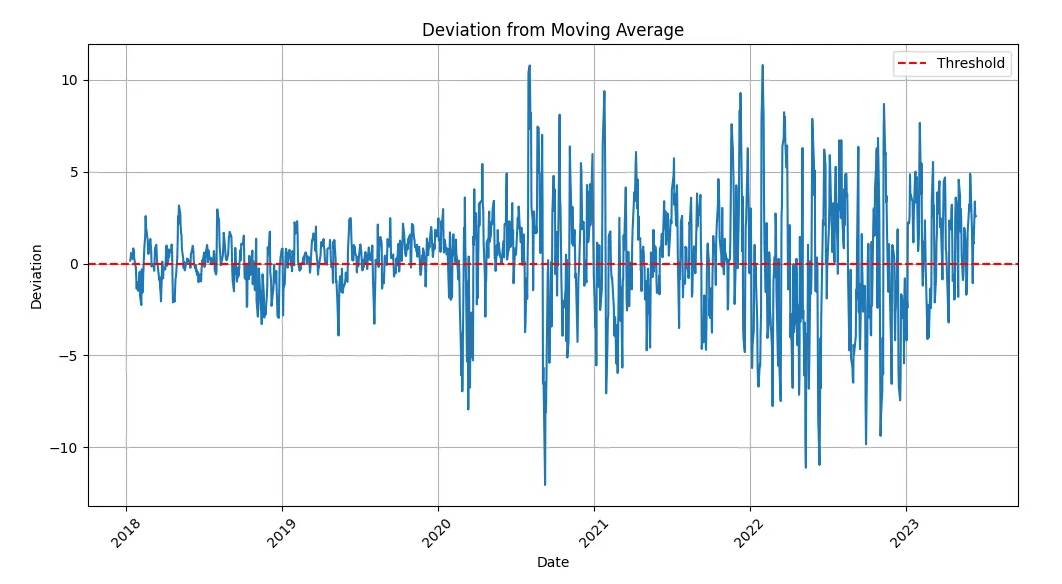
In this example, metrics trends exhibit far greater range, randomness and noise. This sort of behavior is best suitable for ML-based models to detect anomalies.
These systems also integrate real-time and historical data. Yet most ML systems require such complex processing they are unsuitable for real-time analytics; due to the run time of their reporting, they are purely for post-hoc analysis. Moreover, these types of algorithms and methods can be so complex they require a data scientist to be part of your team to create the model and effectively establish how to analyze the results.
Selecting the right model for one’s needs
The choice between these methods hinges on several factors, including data complexity, the need for adaptability, and the level of expertise available. Let’s explore the decision-making process:
| Model type | Rules-based | Data sciences-based | ML-based |
| Characteristics | Simplicity and speed | The balance between customization, speed, and interpretability | Suited for dynamic, complex scenarios |
| Applications | Simple systems with known patterns and basic parametric thresholds (e.g., HVAC temperature control, IT observability) | Monitoring complex systems with regularly changing (periodic) patterns, (e.g., business metrics, product metrics) | Rapidly and stochastically changing patterns, (e.g., network traffic, financial fraud) |
| Cost/Complexity | Low | Medium | High |
Data science models for accurately detecting real-time anomalies across time series trends
Data science-based anomaly detection models use statistical methods to detect anomalies in data without resorting to complex and heavyweight compute-intensive machine learning processes. They can integrate historical trends data, understand various time series trends, and watch for emergent anomalies in real-time.
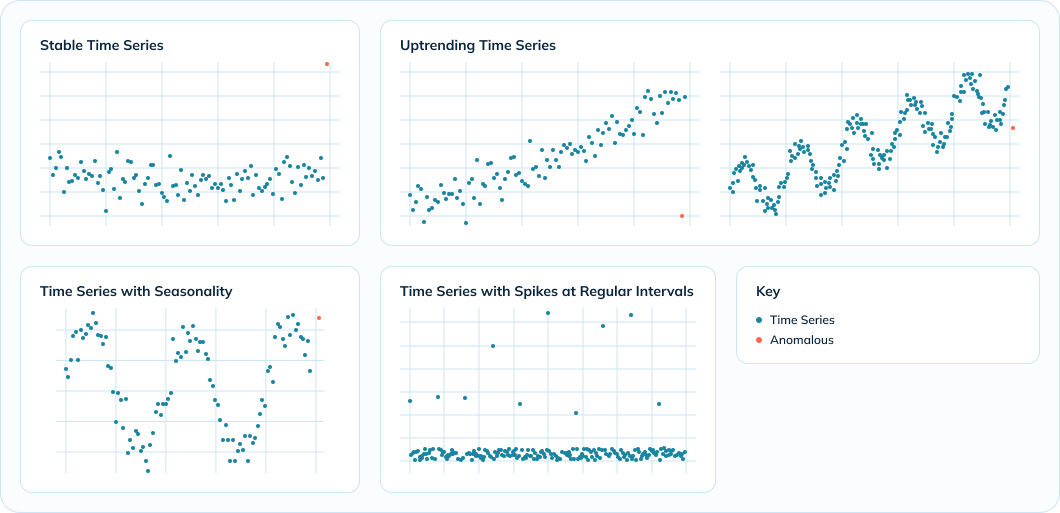
Note: The above image demonstrates various time series trends
Data science models excel in detecting anomalies across various time series trends due to their adaptability to different patterns, effectiveness in handling up-trending and seasonal data, and ability to distinguish regular spikes from genuine anomalies. These models offer scalability, efficiency, and real-time detection capabilities, along with continuous learning for improved accuracy over time. Their customization and flexibility make them ideal for diverse applications and industries.
Consider seasonality in time-series trends for different industries. For example, U.S.-based B2C retailers might see big annual spikes during Black Friday/Cyber Monday and throughout the Christmas shopping season, and a few other lesser annual sales events — President’s Day, Fourth of July, Labor Day, and so on. B2B companies might have some seasons that do better than others, yet would focus more heavily on managing their end-of-quarter spikes. Stocks face what is known as the “September Effect” when the S&P 500 has historically declined more often than it has risen. Spotting anomalies as soon as they occur during these periods of critical activity allows companies to respond in real time to emergent issues.
Basic rules-based systems would not be able to understand these historical trends. They might also flag expected seasonality effects as anomalies — producing many false positive results. These seasonality effects are also obvious and intuitive enough to watch without requiring sophisticated ML models to detect. This makes statistical anomaly detection models well-suited for real-time metrics monitoring with time-series data.
Real-time anomaly detection with StarTree ThirdEye
StarTree ThirdEye offers no-code/low-code real-time anomaly detection for time-series data, using data science-based algorithms. It makes accurate anomaly detection effortless, with out-of-the-box ready-to-use models, combining anomaly detection, monitoring, and interactive root-cause analysis in a comprehensive all-in-one platform.. StarTree ThirdEye is built on top of StarTree Cloud, our fully managed real-time analytics platform powered by Apache Pinot.
Benefits of using StarTree ThirdEye:
- Accurate, data science-based anomaly detection for complex, seasonal data.
- No-code/low-code UI for easy use.
- Real-time monitoring (>= 15mins) for instant anomaly identification.
StarTree ThirdEye is a powerful, user-friendly tool for monitoring real-time metrics with time series and seasonal data. It empowers businesses to identify precise anomalies and drive business improvements.
If you want to explore and try StarTree ThirdEye, you can:
- Request a demo
- Sign up for the StarTree Free Trial
- Join the community
- Learn more about StarTree ThirdEye
