Building a Real-Time User-Facing Dashboard with Apache Pinot and the Ecosystem

When we hear the term “decision-maker,” we often picture a “C-suite” or an “executive” looking at a computer screen full of numbers and charts, leveraging analytics to make data-driven business decisions. The question is should CEOs be the only ones who make decisions? Can it be a regular user like you and me?
With the abundance of technology and connectivity, many online platforms enable their users to get on-boarded, create digital content or provide services. These users need access to timely and actionable analytics to measure their content performance and tweak them to improve customer service.
For example,
- Medium offers content statistics to their writers to tweak their content.
- YouTube offers analytics to its video content creators, enabling them to tweak their content for maximum engagement.
- UberEats Restaurant Manager provides real-time metrics to restaurant owners about their performance to improve menu items, promotions, etc.
These trends enable regular users to access analytics to make data-driven decisions, democratizing analytics across the board. That leads us to user-facing analytics: Giving users access to real-time data and analytics from within the product App or platform where they can take action.
Imagine if you are such a platform of millions of users. How would you provide your users with real-time actionable insights? What should a typical analytical infrastructure look like? What are the possible challenges you would face?
This multi-part article series gives you hands-on experience in planning, building, and maintaining a user-facing real-time dashboard with Apache Pinot and its data ecosystem. The first installment of the series sets the foundation for the entire series and highlights critical decision points you need to consider in the architecture.
Use Case
Let’s take a fictitious use case throughout the series for better understanding.
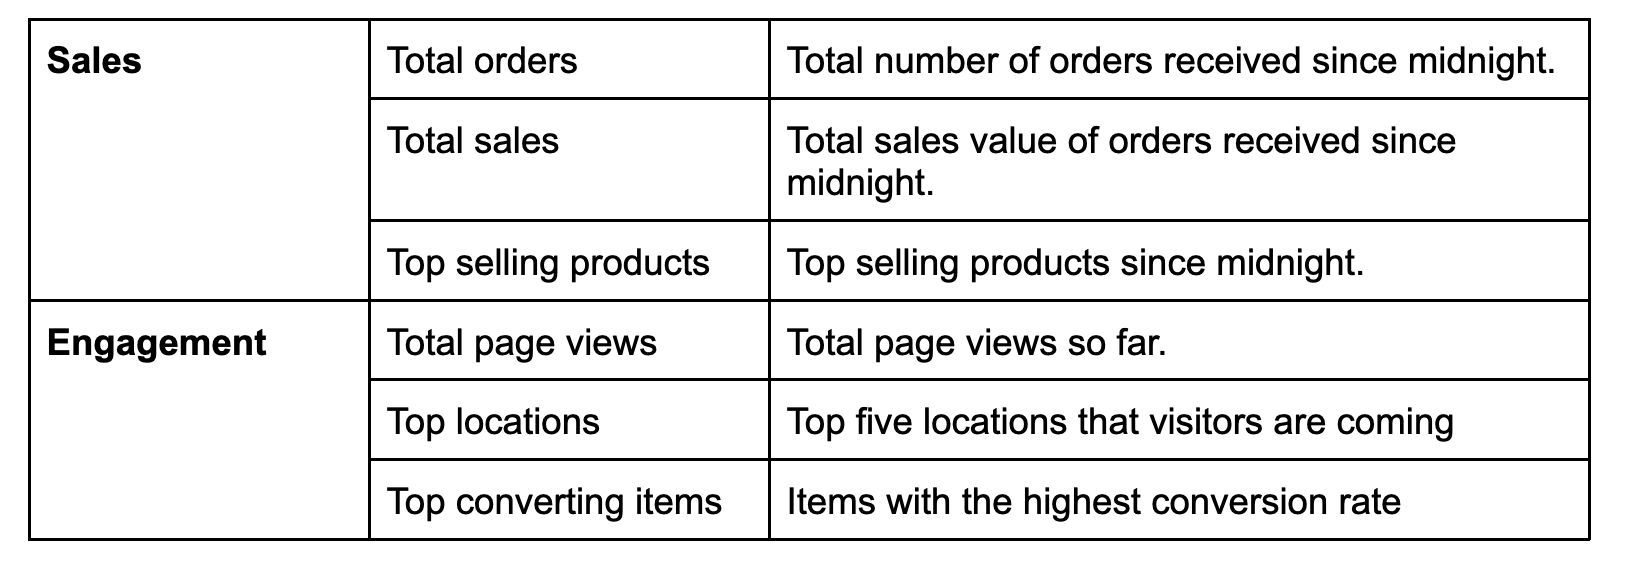
ACME.com is an online store platform that allows users to create online stores and sell products worldwide. You could think of it as being similar to Shopify. The product team at ACME.com plans to provide a real-time dashboard for sellers to track and measure their sales performance, customer satisfaction, and marketing promotions. The dashboard would enable sellers to quickly identify sales trends and maximize profits from the ACME platform.
The dashboard should provide these metrics at a high level.

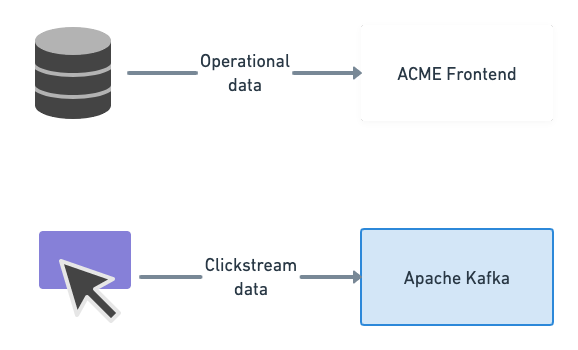
The current data infrastructure consists of a MySQL database that has been used as the System of Record, capturing product information, users, and transactions.
Stores capture and publish user behavior (e.g., page views and clicks) to a Kafka cluster in real-time.

Figure 01 – Current data sources in place
Having this information in hand, how would you plan the initial architecture of the dashboard? What capabilities should it deliver in real life? Let’s find out.
Key Capabilities of the Dashboard
The seller dashboard MUST fulfill the following requirements at scale.
Sub-second query latencies: The dashboard should fetch and render analytics with stringent latency SLAs, usually in the millisecond range. That would guarantee a pleasant user experience.
Query throughput: The dashboard will be accessed by hundreds of thousands of sellers on the platform, resulting in the execution of thousands of queries per second. The analytics backend should withstand higher query throughput while adhering to the stringent latency requirements.
Data freshness: Sellers should be able to see their store performance in real-time. If a sale happens during the last five seconds, it must be visible on the dashboard. Hence, a data freshness of seconds would be ideal.
Query complexity: The queries generating sales metrics involve aggregate operations, joins, and filtering across multiple dimensions over large datasets. These queries are typically answered by OLAP data warehouses.
To satisfy all these needs, we need an analytical database that can execute OLAP queries at the speed and scale of an OLTP database. This is where Apache Pinot comes in.
Solutions Architecture
Given the business and technical requirements mentioned above, we can come up with the following architecture.

Figure 02 – Solutions architecture includes real-time components
Considering the data journey across different components, we can divide the architecture into several stages.
Data Ingestion Stage

Figure 03 – Real-time data ingestion from operational and behavioral data sources
The primary goal of this stage is to extract data as it is produced and move it to the streaming data platform, which is Apache Kafka. Having Kafka in the architecture is critical as it provides scalable and fault-tolerant data ingestion from various data sources.
The MySQL database houses the operational databases required for store operations, including users, items, purchases, payments, and shipments. Traditionally, a batch ETL tool is periodically used to extract data from these databases. But, the goal here is to collect operational data records as they arrive. We will use Debezium for that.
When configured, Debezium watches the MySQL commit log for row-level changes, transforms them as change events, and streams them into a Kafka topic in real-time.
The remaining source is clickstream data that we need to collect from the store website frontend. This data includes the page views and button clicks performed by ACME.com users. For the scope of this series, we will use a Python script to simulate clickstream data generated by random users and publish them into a different Kafka topic.
Streaming ETL Stage

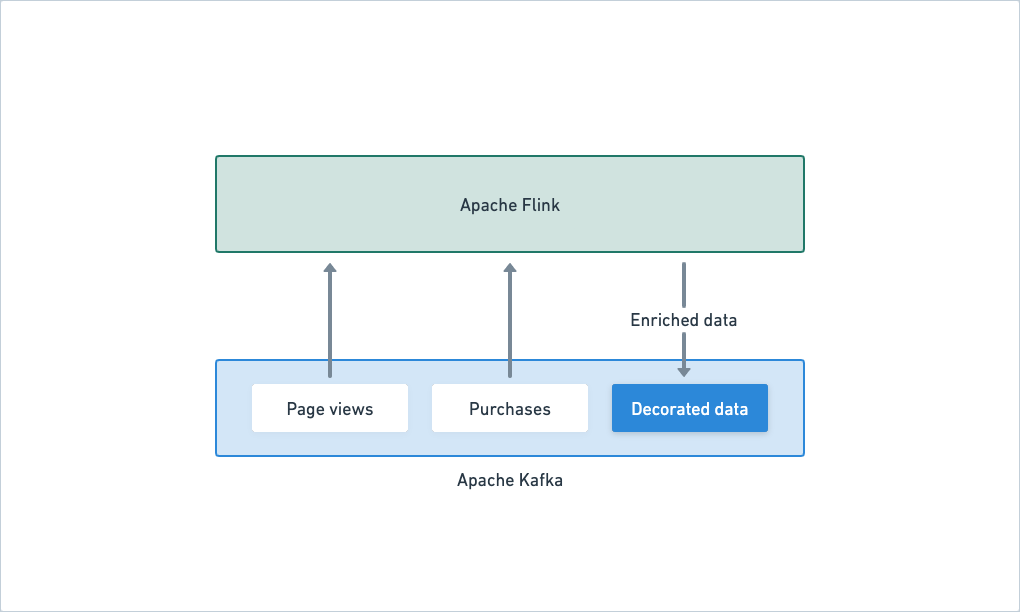
Figure 04 – Streaming ETL performed by Flink to join different streams
The data ingested into Kafka will be pre-processed during this stage. That includes cleaning, joins, enrichment, aggregation, window operations, etc. Traditionally, that has been done by a batch ETL pipeline. But we can’t afford to lose time for that. So we will do the ETL as data is ingested into Kafka. For that, we will use Apache Flink, an open-source stream processor.
Flink can consume from multiple Kafka topics to perform streaming operations and write the output back to Kafka. As we progress through the series, we will use Flink to join clickstream data with purchases on the fly to generate metrics.
Analytics Stage

Figure 05 – Pinot can consume both raw and decorated data from Kafka in real-time
At this stage, Apache Pinot ingests the pre-processed data from Kafka and makes them available for querying immediately. Pinot can ingest from multiple Kafka topics, turn them into segments, optionally index them, and store them for fast retrieval.
OLAP queries coming from the dashboard will be served by Pinot.
Data Consumption Stage

Figure 06 – Sellers interact with the dashboard that fetches data from Pinot
This is the last mile of the data journey where we present the processed data to the dashboard.
We will build the seller dashboard as a React application. It will communicate with a Python Microservice (built with Flask) to ferry data from Pinot.
What’s Next?
This post provided an architectural overview of the dashboard we are going to build in the coming weeks. We will go hands-on to walk you through the implementation details as we progress through the series.
The following are the posts you can expect in the coming weeks.
Part 2: Real-time data ingestion
Part 3: Writing OLAP queries in Pinot to produce metrics
Part 4: Building the React dashboard to render sales metrics
Stay tuned.