
This is the sixth and final lesson in the Apache Pinot 101 Tutorial Series:
- Lesson 1: Up and Running with Docker
- Lesson 2: Ingesting Data with Kafka
- Lesson 3: Ingesting Batch Data
- Lesson 4: Indexes for Faster Queries
- Lesson 5: Queries with SQL, Joins
- Lesson 6: Visualization with Superset
In this post you’ll create a dashboard to visualize the changing price of Bitcoin and view the total value of the portfolio. Apache Superset is an ideal tool for this.
Superset is an open-source data visualization platform that makes it easy to assemble dashboards without much coding knowledge. Dashboars can be built on top of visualization tools, a variety of data platform integrations, and an SQL editor.
Superset is initialized with the Docker compose application you cloned for this tutorial.
Start by navigating to the folder which contains the code for this series and execute the script which initialises Superset. Run the following command.
./init-superset.shThis will create the admin user and setup permissions to use Superset. Navigate to http://localhost:8088 to view the Superset UI.
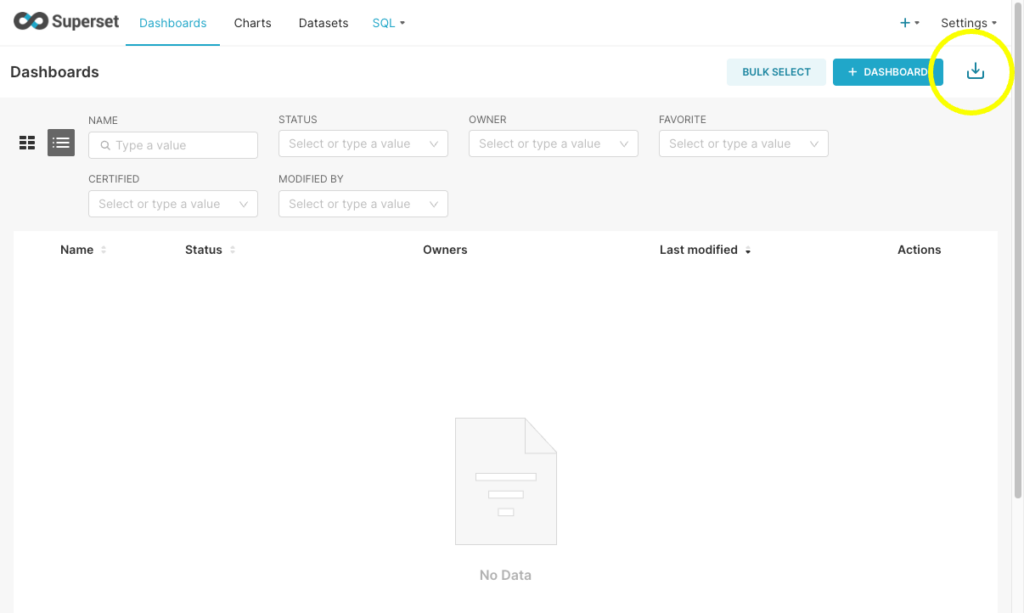
Click on “Dashboards” at the top and then click on the “Import dashboards” icon on the far right.
In the pop up that appears, click on “Select File” and select the ZIP file that is present with the repository. This will import the dashboard, the datasets, and the database connection information into Superset. Once the file is successfully imported, you should be able to see a dashboard called “Portfolio”. Click on it to open it.
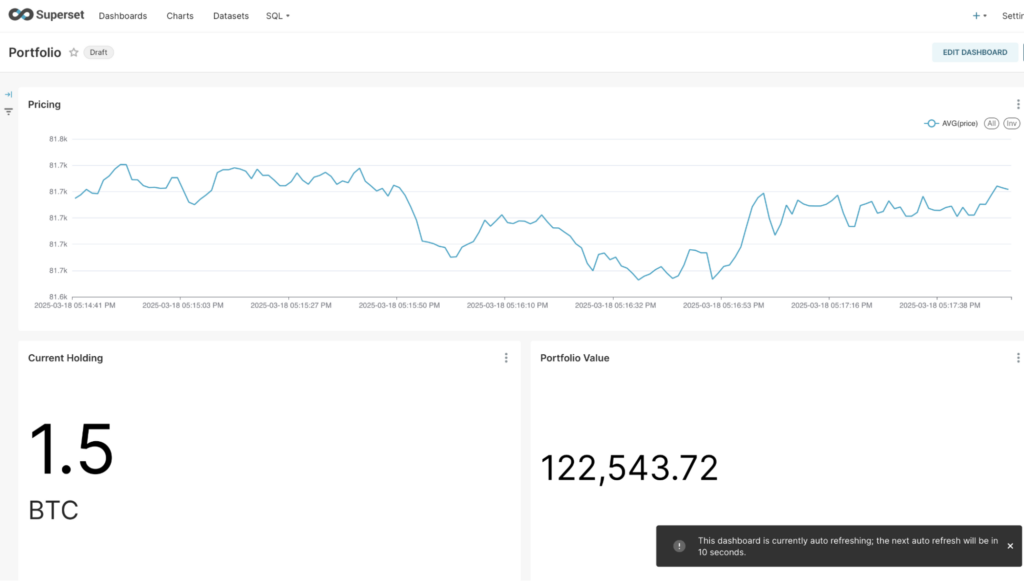
Click on the three dots next to “Edit Dashboard” and click “Set auto-refresh interval”. Select “10 seconds” and click on “Save for this session”. This will re-run the Pinot queries every 10 seconds to refresh the data as it gets ingested. You should be able to see the price of Bitcoin and value of the portfolio change in real-time.
That’s how to visualize data from Superset using Pinot.
And that brings us to the end of the Pinot 101 series. To recap, we started this series with a brief overview of Apache Pinot. We then saw how to ingest data as both batch and real-time. We then added an index to our table and saw how to run queries against it. Finally, we concluded with how to create a Superset dashboard to view the value of the portfolio in real-time.