You can gain valuable insights from time series data by identifying top dimensions driving critical metrics. By drilling down to the atomic level, dimension-level granularity can help identify specific contributors to anomalies or trends. This feature enables businesses to detect and address issues at a much more granular level.
Learn more about how StarTree ThirdEye enables this powerful technique and its applications in this blog.
StarTree ThirdEye is a real-time anomaly detection platform built on top of StarTree Cloud that allows organizations to monitor critical business KPIs/metrics and detect anomalies. It enables key stakeholders to take corrective action in real time, leveraging actionable insights and helping businesses save millions of dollars.
The StarTree ThirdEye team recently launched two features we want to highlight — Dimensions Exploration and Dimensions Recommender — which calculate top contributors that are driving metrics.
What is StarTree ThirdEye Dimensions Exploration?
StarTree ThirdEye provides Dimensions Exploration to identify hidden issues before they become business-impacting problems. StarTree ThirdEye uses algorithms to automatically detect anomalies in data at different levels of granularity or dimensions. (Learn more.)
In the food delivery industry context, this technique can identify anomalies or unusual patterns in various dimensions, such as delivery time, order type, order size, customer location, and restaurant performance. This empowers delivery managers and customer support teams to proactively address issues and optimize operations, ensuring timely and satisfying food deliveries for customers. Here’s an example:
Let’s say a food delivery company has been experiencing a sudden increase in customer complaints about food delivery. To identify the cause of this issue, the company could automate the identification of top dimensions driving the customer satisfaction metrics, such as:
- Delivery time by day of the week
- Delivery time by an hour of the day
- Delivery time by the driver
- Delivery time by the restaurant
- Delivery time by customer location
- Wait times or long delivery windows
- Failures to deliver
- Order problem
- Order type
The algorithm would then identify any anomalies or unusual patterns in the data. For example, it may find that delivery times are consistently longer on Thursdays and Fridays, or some restaurants have significantly longer delivery times than others.
Once the anomalies have been identified, the company can take corrective action to address the issue. For example, they may adjust delivery routes, assign different drivers to certain areas, or work with restaurants to optimize their order fulfillment process or to enable more restaurants to fulfill the demand for different days.
In this way, StarTree ThirdEye’s automated Dimensions Exploration can help food delivery companies identify and address issues affecting their business performance, ultimately improving the customer experience.
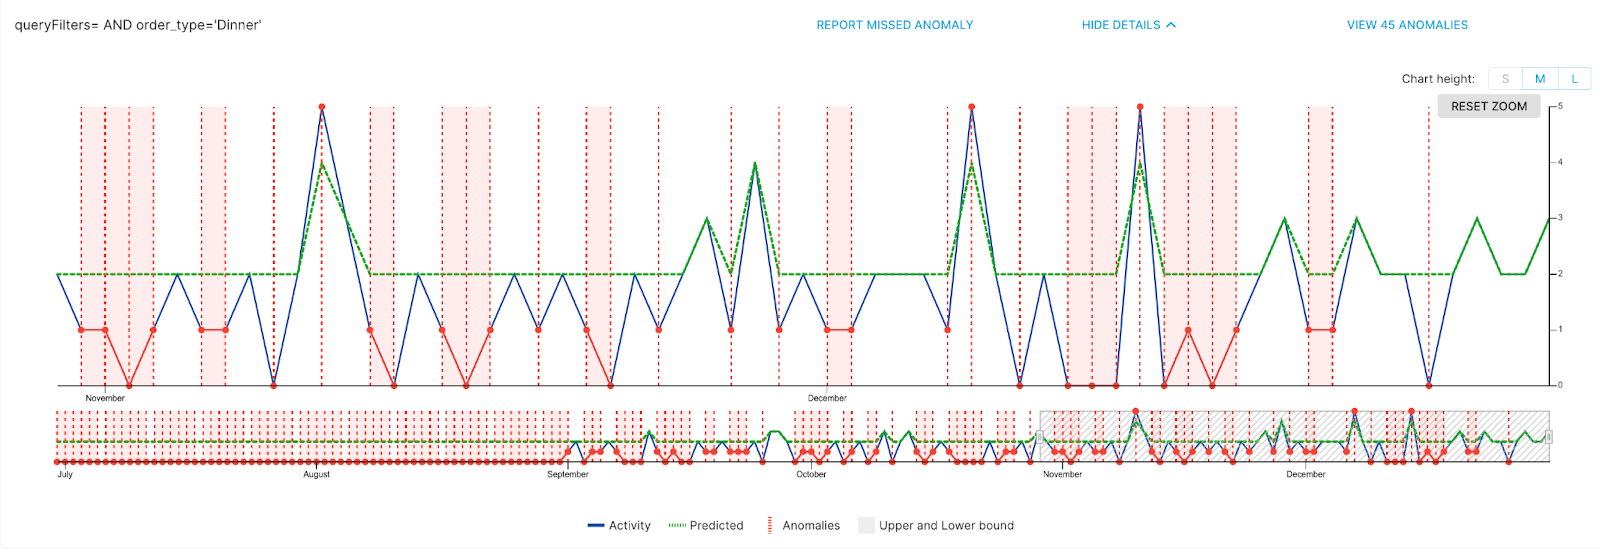
Simple threshold (min-max) based anomaly detection in delivery time (metric) broken down by order type (dimension)

Figure 1: Basic parametric anomaly detection with thresholds (minimums and maximums) may create false positives by not understanding regular business patterns, such as lulls or peaks due to weekends or holidays, or due to other historical trends.
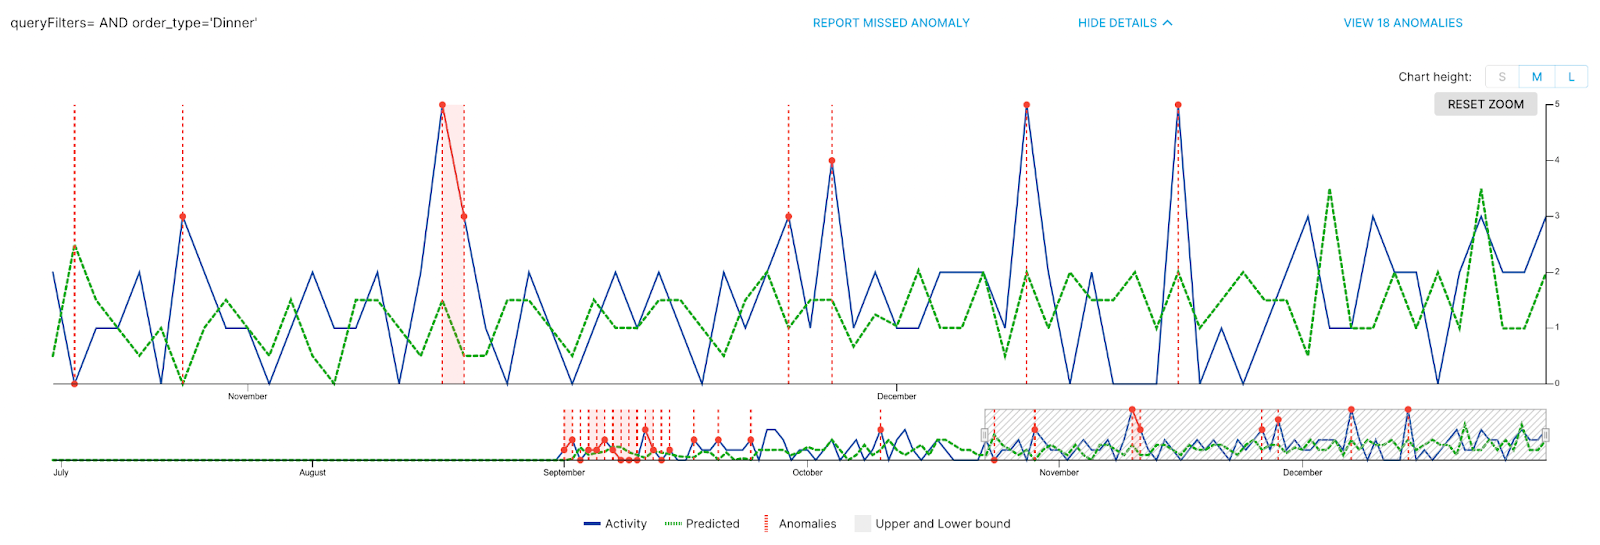
Advanced anomaly detection in delivery time (metric) broken down by order type (dimension)

Figure 2: By using statistical modeling, anomaly detection can be tailored to understand pre-existing patterns of behavior, whether daily, weekly or annual patterns of business, as well as other trends. Note how the expected minimums and maximums change day-by-day, and how the range begins narrower in November and widens over the course of December.
What is StarTree Dimensions Recommender?
StarTree ThirdEye Dimensions Recommender uses statistical and regression analysis to recommend the top contributing dimensions (metrics driver) that have the highest impact on your metrics. (Learn more.)
As data grows, it becomes difficult to know which dimensions to monitor instead of boiling the entire ocean. StarTree ThirdEye Dimensions Recommender assigns a score to each dimension and to combinations of dimensions and stack-rank orders so you can decide which to monitor.
The statistical analysis looks for the strength of correlation and direction of the relationship between two dimensions, identifying strong positive or negative associations with the metric. Additionally, regression analysis is used to identify the dimensions that have the most significant impact on the metric by estimating the coefficients of each dimension in a linear model.
StarTree ThirdEye users can use its automated anomaly detection algorithms to detect outliers in time series data for these prescribed dimensions, quickly identifying any unexpected changes in the metric with dimension-level granularity and taking appropriate corrective action.

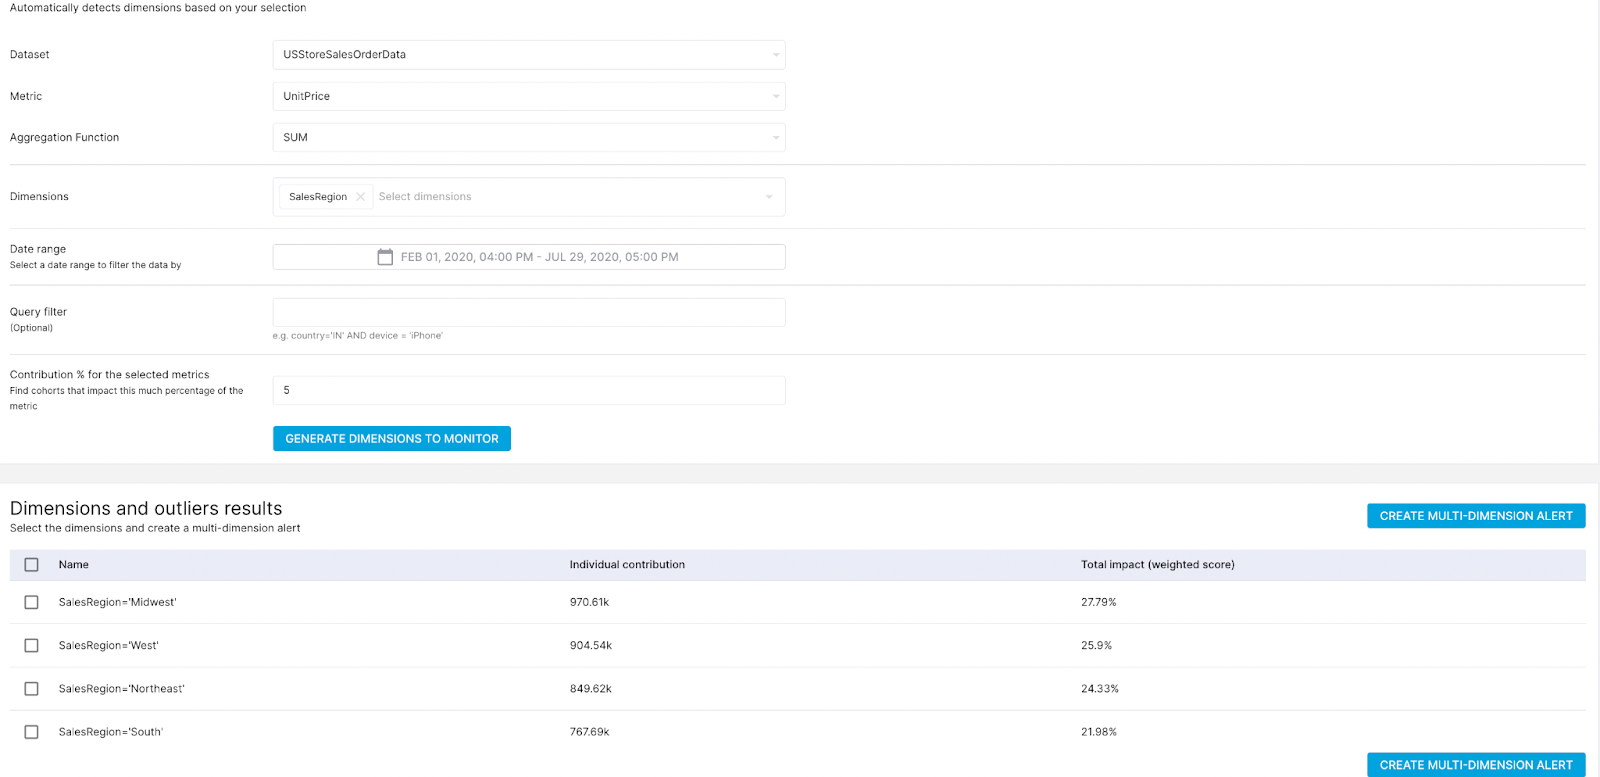
Figure 3: In this illustration, once data is input into StarTree ThirdEye, it reveals the key dimensions responsible for metric changes within a specified timeframe. This eliminates the need for monitoring all dimensions; users can focus on those with the most significant impact on metric changes.
A practical example of real-time anomaly detection
By monitoring the dimensions with the highest impact on the metric and using an automated anomaly detection algorithm to detect outliers, one can quickly identify potential issues and take appropriate action to address them.
Imagine a dataset containing information about the sales of a retail company, and there is a need to identify the dimensions that have the highest impact on the total sales metric. To do this, StarTree ThirdEye Dimensions Recommender can be used to estimate the coefficients of each dimension in a linear model — i.e., what factors are directly causing the rise or fall of any metric.
Suppose the collected data has the following dimensions for each transaction:
- Product Type
- Sales region
- Day of the week
- Time of day
- Promotion type
- Customer demographics
A linear model can be applied to the data, with total sales as the response variable and the six dimensions as the predictor variables. The coefficients of each predictor variable in the model will give us an estimate of its impact on total sales.
After fitting the model, sales region, promotion type, and time duration dimensions are identified as having the largest coefficients and the greatest impact on total sales. These dimensions are recommended for monitoring purposes. To detect any outliers in the time series data, an automated anomaly detection algorithm can be applied to monitor these recommended dimensions.
For example, suppose there is a sudden drop in sales at a particular sales region. In that case, the anomaly detection algorithm will flag this as an anomaly and will alert the user to investigate further. Similarly, suppose it is noticed that a particular type of promotion is not generating the expected increase in sales. In that case, the algorithm may flag this as an anomaly and prompt the business to make changes to its promotion strategy.
The benefits of using anomaly detection to identify top dimensions
There are many benefits to identifying top dimensions, including:
- Faster Issue Resolution : Identify and address anomalies swiftly at a granular level, reducing potential disruptions.
- Cost Savings : Minimize unnecessary expenditures caused by monitoring all dimensions and focus on monitoring the key drivers.
- Customization : Tailor detection algorithms to match the unique characteristics of your business.
- Comprehensive Insights : Gain a holistic view of operations for better-informed decisions.
- Informed Decision-Making : Make timely, data-driven decisions to adapt to changing dimensions.
Conclusion
Discovering key factors influencing critical business metrics at a detailed level and automating anomaly detection and monitoring across various time-series data can bring significant benefits to businesses.
To learn more about the technical concepts, please visit this page for Dimensions Exploration and this page for StarTree ThirdEye (Top) Dimensions Recommender (Metrics Drivers).
You can also see these features in action in this live demo by StarTree and JustEats from Real-Time Analytics Summit 2023:
If you want to explore StarTree ThirdEye, you can:
- Request a demo
- Sign up for the StarTree Free Trial
- Join the community
- Learn more about StarTree ThirdEye

