One of Southeast Asia’s largest makers of ‘super apps’ – is powering real-time observability in its rideshare marketplace with Apache Pinot. Its integrated platform supports operations across more than 300 cities with one-second response times.
In this talk from Real-time Analytics Summit 2025, you can learn learn how they do it:
Background
The Grab app is used for ride-hailing, food delivery, and digital payment services on mobile devices across Southeast Asia. Its broad geographic scope and large user base makes observability a crucial discipline for maintaining performance and availability.
Grab’s marketplace generates torrents of data from microservices operating in multiple geographies and verticals, explained Edwin Low, data engineering manager at Grab, in a presentation at the Real-Time Analytics Summit hosted by StarTree. Operations teams need more than just raw data; they need insights they can act on immediately.
The core problem Grab encountered was fragmentation. Metrics were scattered across multiple systems, and accessing them often required manual queries and tribal knowledge. Grab needed to unify observability data into a single, broadly accessible, real-time platform.
To tackle this fragmentation, Grab built two interconnected systems: MarketWatch is an observability portal used by operations teams. Midas is the underlying metrics platform that powers the entire analytics stack.
Anomaly detection and response
MarketWatch allows users to monitor market health filtered by country, business vertical, and time range, with real-time metrics presented in a user-friendly dashboard. The design goals were straightforward, Low said: Watch what’s happening, detect anomalies, and quickly diagnose problems.
Automation and explainability are baked into the architecture. The system goes beyond generating alerts to trigger actions to mitigate slow degradation or emerging issues. Explainability, enhanced by large language models, helps human operators understand what’s happening and why, even when the system is acting autonomously.
A Single Source for Metrics
Midas is the centralized platform that allows producers to define metrics once for reuse across observability, experimentation, reporting, and even LLM interfaces. Owners of metrics like cancellation rates need only define them once in the metadata layer, and that definition can then be reused everywhere.
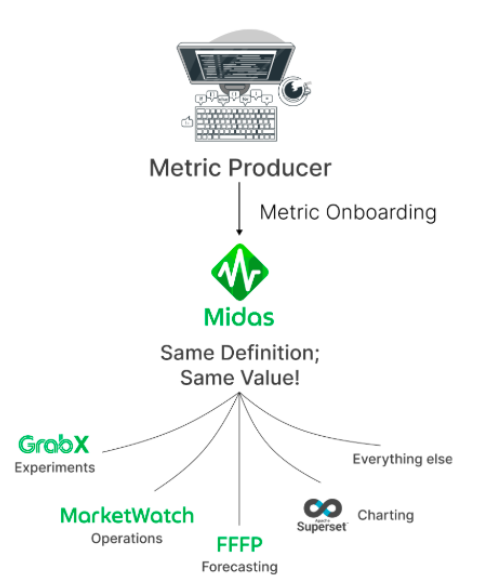
Traditionally, analytics teams would retrieve metrics with SQL queries, but Grab abstracted that complexity in Midas. Instead of writing SQL, data consumers send API requests specifying which metrics they want, filtered by variables like location or time range. Midas automatically generates and runs the SQL using consistent definitions stored in its metadata service.
This approach eliminates inconsistencies between dashboards, reports, and experiments—a common headache in large organizations.
Flexible slicing and dicing of metrics at query time
For real-time metrics, Grab uses a standard architectural pattern with a few twists. Microservices generate real-time events, which are then streamed via the Apache Kafka distributed event streaming platform. Apache Flink takes care of the preprocessing tasks of cleansing, enriching, and filtering the data.
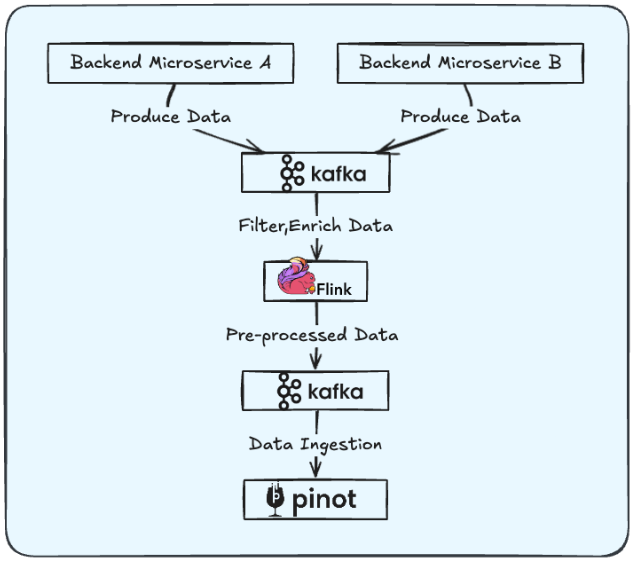
Processed data is written to the Apache Pinot real-time OLAP datastore, a process Low likened to building fact tables on the fly. Pinot then enables flexible slicing and dicing of metrics at query time. There is no need to pre-aggregate by every dimension for each user.
This architecture was originally tuned to support fine-grained real-time views of just a few minutes. Subsequent enhancements were put in place to support more complex aggregations over periods of as much as six months. Those historical timelines are crucial for tasks like ML model training.
Reusable metrics
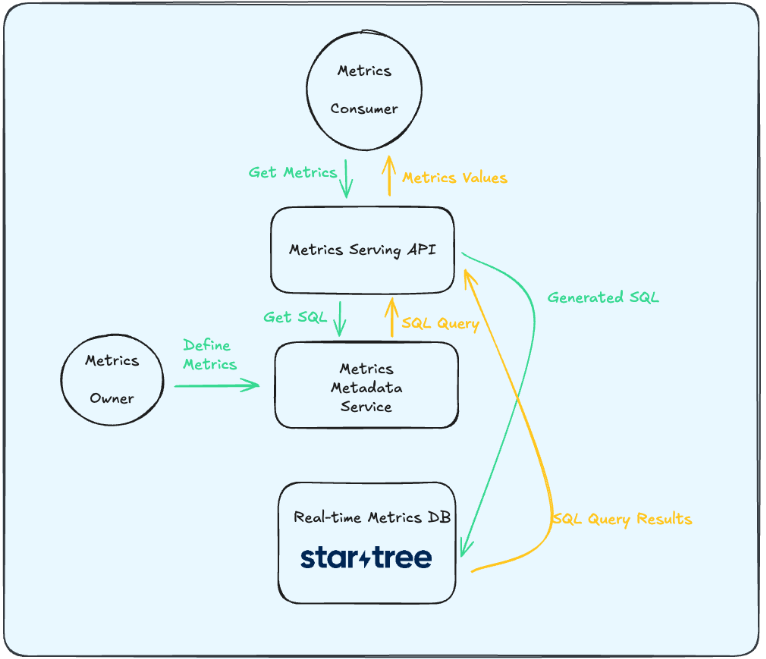
Serving a metric now follows a consistent pattern. A request hits the serving API, which consults the metrics metadata service to determine how to construct the SQL query. SQL is executed on Pinot, and the results are returned. Reusable metrics contribute to consistency and scale.
Midas has seen explosive adoption, Low said. Daily metric requests have doubled in just six months to more than 10 million per month. Despite that scale, latency has remained low, with 95% of requests completed end-to-end in about one second.
Grab is continuing to push the envelope. Current development priorities are to integrate forecasting and root-cause analysis APIs into Midas and MarketWatch so all services can benefit from predictive insights. Batch APIs are being built for the large-scale historical queries used in machine learning training. LLM integration will allow users to interact with metrics in conversational language.
Grab’s approach is a blueprint for real-time observability in complex, multi-service environments. By separating the interface from the infrastructure and focusing on consistency, automation, and explainability, it has built a system that serves everyone from operations teams to data scientists to AI models.
Learn more
Learn how you can make the most of observability and monitoring with open source tools including Apache Pinot with this complimentary ebook – Download: Open Source Observability from O’Reilly.
StarTree makes it easy to experiment and deploy Apache Pinot. Book a demo to talk with us about how you can build an open source observability stack with Apache Pinot.