Rebalancing is one of the most important operational tasks in distributed systems. It ensures that data is evenly distributed, prevents skews, and helps smooth out resource utilization hotspots so that workloads are shared fairly across the cluster.Without it, some servers end up overloaded while others sit idle, leading to wasted resources and unpredictable performance.
In online systems that serve live traffic, rebalancing is even more critical. These operations need to be performed regularly as clusters evolve—whether new servers are added, old ones are retired, or replication factors and table configurations change. And they must be done without service downtime and with minimal impact on query performance.
Apache Pinot is no exception. As a distributed system designed for low-latency real-time analytical queries at scale, cluster wide changes happen often. Pinot relies on efficient rebalancing to keep segments distributed properly, ensure resources are fully utilized, and maintain the predictability customers expect.
To see why this matters, imagine a simple case: a cluster with two servers. Data segments are evenly distributed, and both servers are serving queries just fine. Now you add a third server.
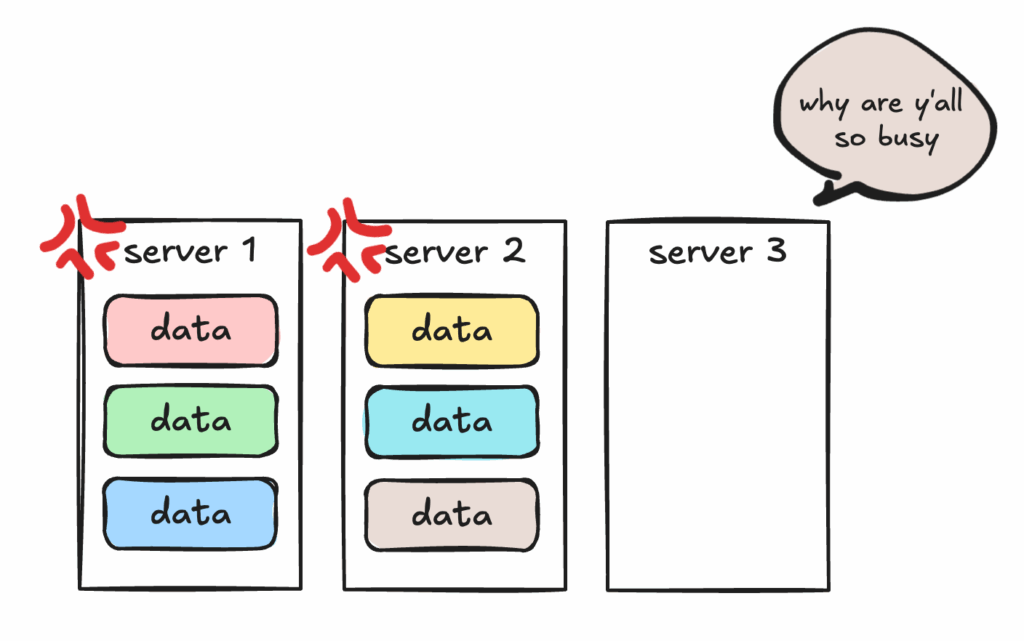
What happens? At first—nothing. The new server can start hosting newly added segments, but none of the existing segments will be moved, leading to data skew. Unless you rebalance. Rebalance moves segments across servers so the workload is evenly shared.
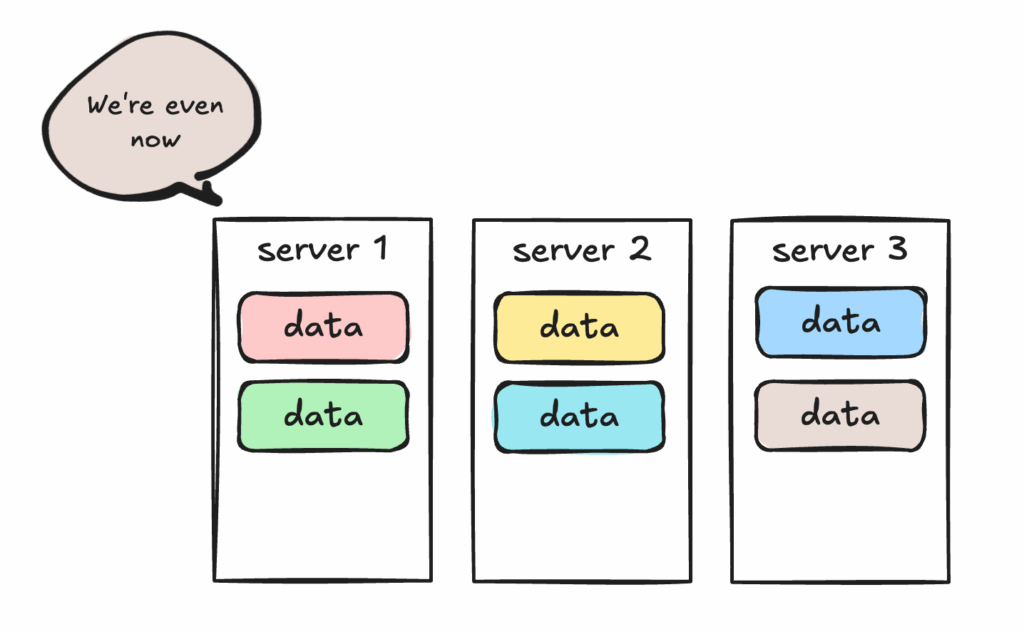
That’s the essence of rebalance: whenever the cluster changes, it ensures data is placed where it should be. Add a few more servers to handle a hotspot? Rebalance. Migrate data to cheaper machines with new tags? Rebalance. Without it, new resources stay underutilized and old ones stay overloaded.
Here are the most common situations where a rebalance is required:
1. Change in the number of servers
Like in the example above, when you add a server, it has no data until rebalance assigns segments to it. Conversely, when you remove a server, rebalance hands off its segments to other servers before it can safely be decommissioned.
2. Change in replication factor
Rebalance doesn’t just move data; it can also copy or remove it. If you increase replication, rebalance tells servers which additional copies to acquire. If you decrease replication, it identifies which copies to drop.
3. Change in table layout
Sometimes servers are tagged by region, machine type, or other criteria. If a table’s tag changes, rebalance migrates its data to servers matching the new configuration.
4. Change in assignment strategies: Pinot supports advanced configuration strategies for server instance selection and segment assignment. If changed, all of these will need a rebalance operation to move the data in place.
There are no free lunches, and that’s also true of rebalance. Rebalance is a resource intensive operation as it involves moving large amounts of data within the cluster–downloading and processing segments on a server takes up compute, memory, network and I/O bandwidth. It is important to ensure this is done without impacting live traffic, and more importantly, without downtime. Thankfully, Pinot’s deep store architecture provides a solid foundation to perform rebalance.
Real-world challenges with rebalance
Rebalance is an integral part of operating Pinot. But we’ve also seen that running it correctly—especially for large tables—isn’t always easy. Pinot’s rebalance algorithm is comprehensive and covers many scenarios, yet at scale there are operational challenges that need to be addressed to make it simpler and safer.
Here’s what we learned from operators in the community and from our own experience running PB-scale, 100+ node clusters:
Observability Gaps
Large tables can have thousands of segments and tens of thousands of state transition messages. A rebalance may take hours, so it’s critical to know whether it’s making progress—or stuck. Operators want estimates of how long scale-out/scale-in will take, visibility into bottlenecks, and even a preview of expected changes before committing. No one likes discovering something went wrong only after hours of waiting.
Resource Contention Issues
Rebalance moves data, which means higher CPU, memory, and disk usage, plus extra load on Helix from state transition messages. On live clusters, this competes with query execution and can cause latency spikes or instability. Guardrails—like throttling background operations—are essential to ensure smooth user-facing performance.
Predictability Challenges
Customers size their hardware and tune SLAs around expected query patterns. When background operations eat into those resources, performance becomes unpredictable. Guardrails and clear limits help avoid surprises.
Complexity Friction
Operating Pinot at scale is complex enough. Minimizing risky knobs, providing sensible defaults, and surfacing potential issues in advance can make rebalance less error-prone and much easier to run confidently.
Guided by these insights, we identified several key areas to address:
- Pre-Checks – Catch risks early
- Rebalance Summary – Understand data movement
- A Revamped User Interface – Defaults and warnings
- Progress Tracking – Know where you stand
- Stability Enhancements – Guardrails for smooth operations
- New Grafana Dashboard – Observability at a glance
Pre-Checks – Catch risks early
We enhanced the rebalance operation by adding pre-checks. The goal is to catch risky settings and flag any potential impacts before they affect service availability.
Pinot now automatically surfaces common risks—such as servers running out of disk space during rebalance, expensive index rebuilds being triggered, or slow re-bootstrap processes for upsert tables. By flagging these issues upfront, operators can address them early and avoid discovering hours later that a rebalance failed or, worse, disrupted availability.
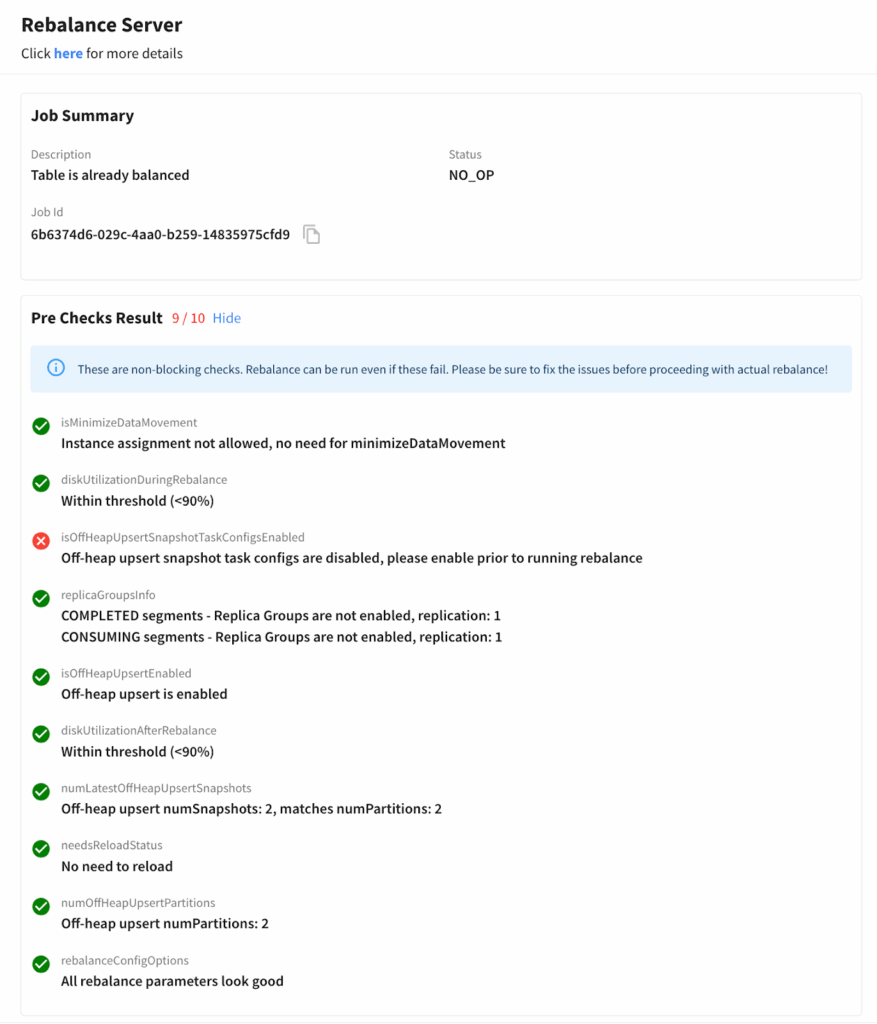
Fig: Pre-checks catch risks early—disk limits, snapshots, reloads—before rebalance ever starts.
For example, pre-checks can catch when target servers don’t have enough remaining disk capacity to host incoming segments. Without that warning, a rebalance might fill up disks and leave the cluster in a bad state—requiring messy manual intervention. Now this information is surfaced before the operation starts, saving hours of recovery effort.
More details in the user doc here.
Rebalance Summary – Understand data movement
Pinot rebalance has a Dry Run feature. Dry Run simulates a rebalance without actually moving data, giving operators a preview of what the new segment assignment will look like. Originally, this produced a large JSON blob showing the before-and-after assignment state. It was useful, but not easy to follow—you had to manually scan through it to spot potential issues.
To make this safer and simpler, we enhanced Dry Run with Rebalance Summary. Instead of relying on operators to parse the output, and figure out if the rebalance operation is doing what is expected the summary gives operators a clear picture of the data movement and its impact—not just which segments will shift, but also what operations will be added on each server and the workload those changes will create.
Server Info
Shows the expected change in data segments per server instance, and highlights which servers are added, removed, or unchanged. This helps verify that the rebalance plan is correct and makes it easy to see how much extra load each server will take on.
Segment Info
Provides statistics on the table’s segments, including estimated size to move, total number of segments, and replication details. For consuming segments, it also shows how many will be moved, their start offsets, and their age. This gives operators visibility into the amount of catch-up work servers will need to perform and whether query staleness might be introduced.
Tag Info
Summarizes segment traffic in and out of each tag—particularly useful when validating correctness in setups that move data across tenants or have tiered storage.
Read more details in the user doc here.
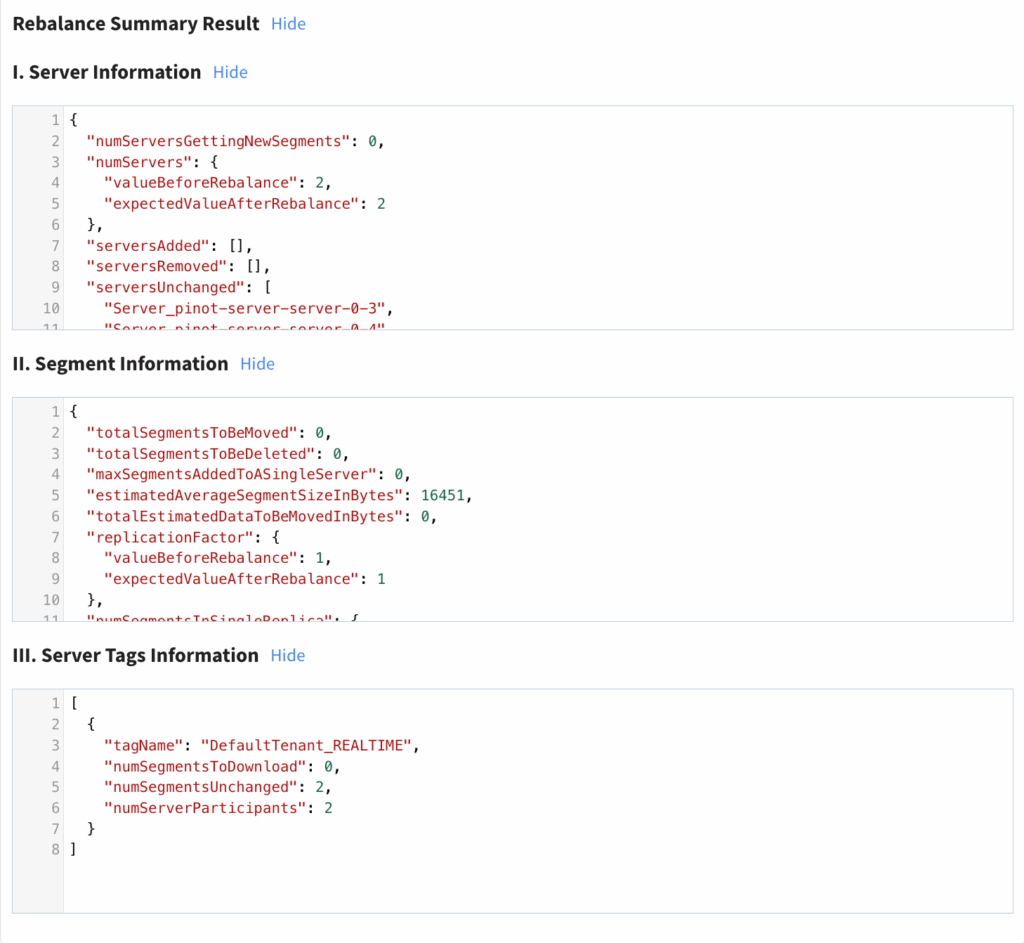
Fig: Summary highlights where segments are moving, how servers are impacted, and what load to expect
A Revamped User Interface – Defaults and warnings
Another area we focused on was making the rebalance user experience easier and more intuitive. The old UI only showed a subset of parameters, with no guidance on what they meant. Operators often had to guess, which made mistakes common and sometimes required re-running rebalance jobs just to get the settings right.
The new UI changes that by providing a guided, user-friendly experience. The new UI provides full visibility into all rebalance options, along with clear explanations so operators know exactly how each setting affects the job. Parameters that could cause downtime or errors are flagged with visible warnings, while recommended defaults are pre-populated to make common scenarios easy. Together, these changes greatly reduce the chance of misconfiguration—and the need to re-run a failed rebalance—while still giving experts the flexibility to fine-tune.
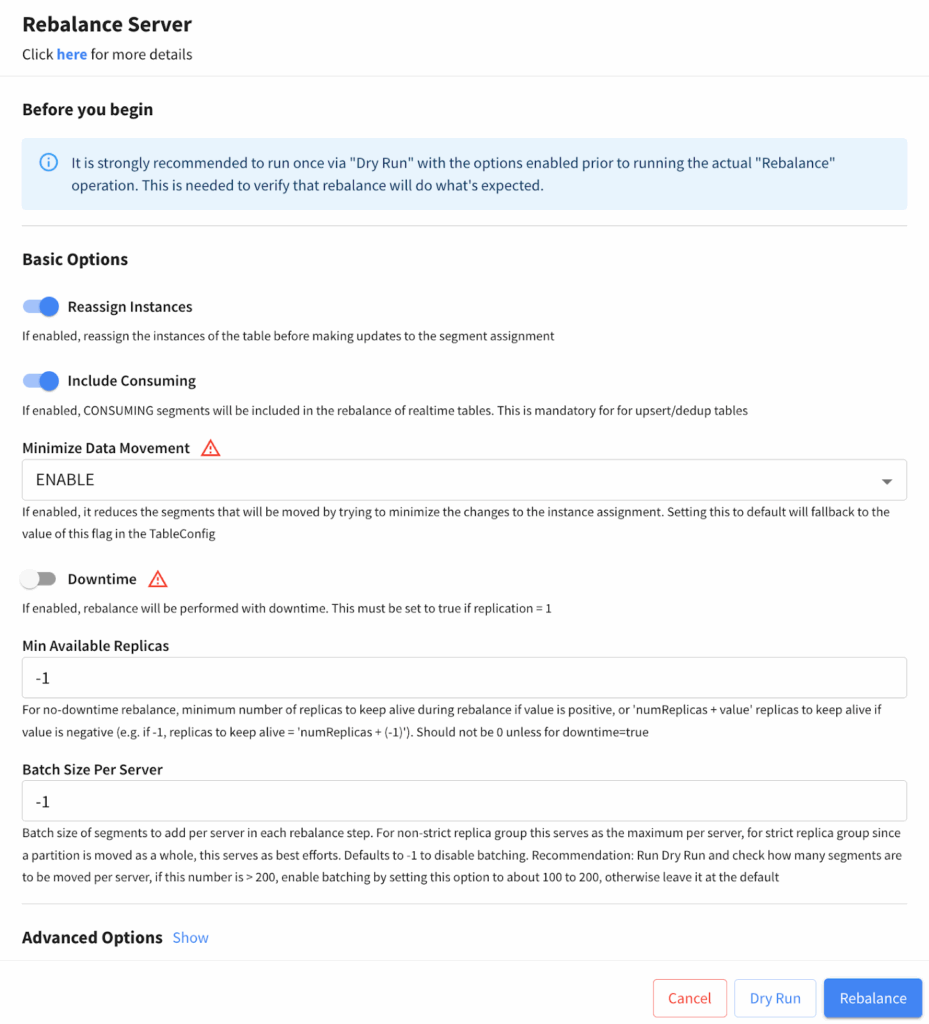
Fig: The new UI surfaces all parameters, adds warnings for risky ones, and guides operators with smart defaults.
Progress Tracking – Know where you stand
Once a rebalance starts, the most critical part is monitoring it—providing operators with clarity and confidence at every step.
During a rebalance, at least one replica is moved at a time, which temporarily reduces the replica count. When a replica is down, other replicas must handle the incoming traffic. Depending on how the system is provisioned, this can impact query performance. That makes it essential to answer key questions in real time: How long will this take? Is progress being made? Is anything stuck?
To give operators this visibility, we’ve enhanced progress tracking with richer statistics, including:
- Total segments to add/delete – understand the full scope of the job.
- Progress percentage – quickly assess how much work remains.
- Estimated time to finish – plan around the expected duration.
- Estimated bytes to move – gauge the scale of data movement.
- Segments yet to converge – catch segments that were added but whose state hasn’t stabilized.
Read more about this in the user doc here.
Stability Enhancements – Guardrails for smooth operations
Table rebalance is inherently resource-intensive—it moves data across the cluster, consuming CPU, disk, and memory. To minimize the impact, Pinot uses segment operations throttling, which controls how many segments can be processed at a time. This ensures that critical workloads like query execution continue to perform reliably, even while data is being shuffled in the background. More details in the user doc here.
Under the hood, every server maintains a Helix message queue that handles different kinds of operations—segment commits, reloads, and rebalance state transitions. When a rebalance job moves a large number of segments, it can flood the queue with thousands of state transition messages. Since each server only has a single queue, this backlog can delay not just rebalance operations but also other essential updates.
To address this, we introduced a new parameter: batchSizePerServer. This setting limits the number of rebalance-related state transition messages sent to each server at once, preventing overload and keeping the message queue responsive for other operations. The result is smoother rebalances and more predictable cluster stability.
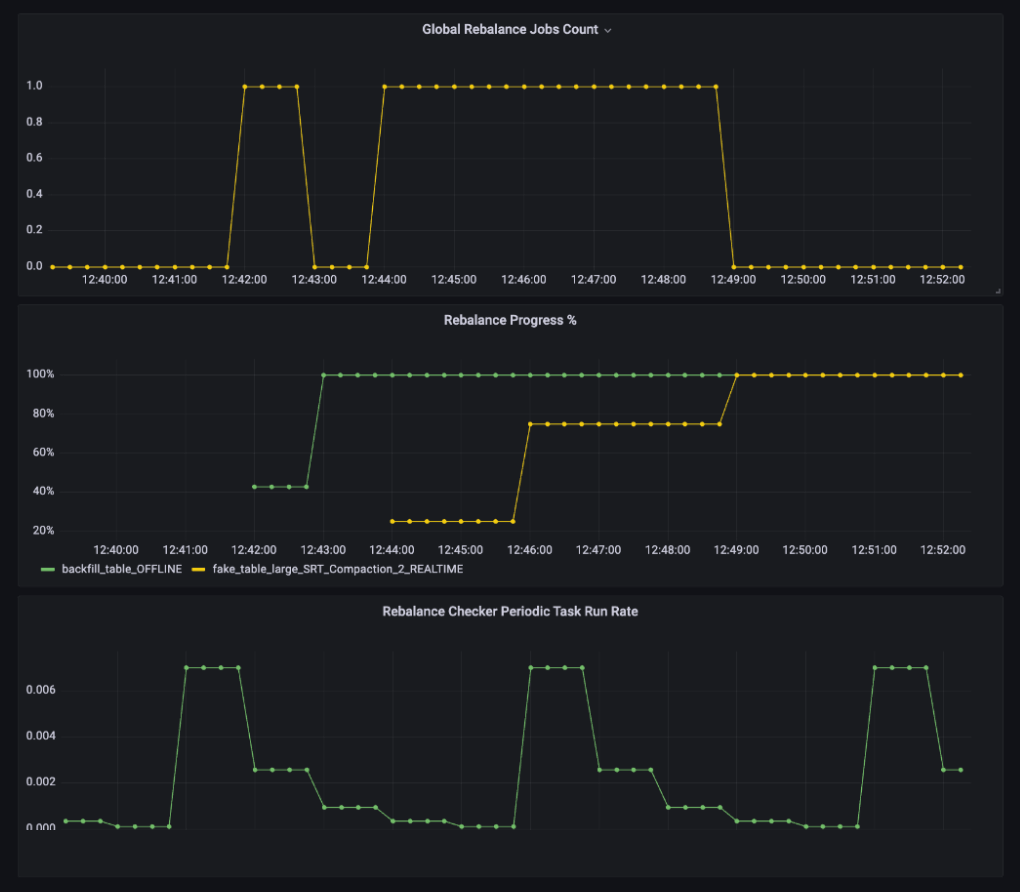
New Grafana Dashboard – Observability at a glance
We introduced a new Table Rebalance Dashboard in Grafana so operators can see both the progress and the impact of rebalance at a glance, alongside other system metrics. By bringing everything into one place, the dashboard makes it easier to correlate rebalance activity with cluster health and get a complete picture of system impact.
The dashboard provides visibility at both the job level and the cluster level:
- Per-job insights: Track the progress of individual rebalances, including completion rate and failures.
- Cluster-wide view: Monitor all rebalance jobs across the cluster, including retry rates and periodic rebalance execution.
- System impact: Check server resource utilization, Helix message queue size, and throttle limits for segment downloads and index builds.
This unified view makes it much easier to spot bottlenecks and understand cause-and-effect. For example, if segment downloads or index builds are consistently hitting their throttle thresholds, you can quickly tie that to slower rebalances and adjust accordingly. By combining job progress with system-level metrics, the dashboard gives operators confidence in both the state of the rebalance and its impact on the cluster.
Conclusion
We have battle tested rebalance at scale after adding the above improvements. For example:
- 50+ server nodes, across 200+ tables, many tables 10+ TBs in size, with 10s of thousands of segments, while serving live query traffic
- 180 server nodes, across 7+ tables, largest being 450 TB+ in size, with 400K+ segments, while serving live query traffic
The new rebalance enhancements are already proving their value in real-world operations. We’ve seen them help with:
- Pre-checks catch issues early: Flagged an Off-heap Dedup table that was failing to create snapshots before rebalance. Restoring the snapshot avoided slow spin-up and potential instability.
- Disk utilization warnings prevent failures: Helped operators spot high disk usage on target servers and choose a different rebalance approach to avoid hitting limits.
- Progress tracking surfaces anomalies: Reported an unexpectedly high number of segment movements (10k+), enabling fast diagnosis and mitigation of a performance issue.
- Batch sizing reduces ingestion lag: Limiting the number of segments moved per server at each step kept Helix message queues from overloading and prevented query slowdowns and delays in REALTIME segment commit processing.
- Grafana dashboard drives quicker decisions: Operators correlated rebalance activity with system metrics like CPU, memory, and segment throttles, making it easier to identify bottlenecks and tune thresholds.
These improvements help rebalance feel less like a risky operation and more like a predictable, observable process—one operators can run with confidence, even at scale.
Connect with us
If you’re operating at PB scale, serving millions of users and tens of thousands of queries per second, you should connect with us. We’d be delighted to share our lessons in serving at scale, hear your use cases, and geek out over low-latency analytics.
- Join the community slack Apache Pinot, StarTree Community
- Follow our adventures on LinkedIn StarTree
- Catch us on X Apache Pinot, StarTree