Most logging stacks are built to ensure data is captured, preserved, and searchable. Incidents like outages, security breaches, fraud detection expose how efficiently that data can be explored under pressure.
The difference shows up at the worst possible moment. An incident starts. Error rates spike. Latency drifts. Someone pastes a trace ID into a query bar. Within minutes, dozens of engineers are running ad-hoc filters across nested JSON payloads, joining mental models across services, collapsing time windows from hours to seconds. And it breaks systems that were built with pre-aggregated views or sampled data to power dashboards.
What modern teams are building instead is a centralized application logging cluster optimized for both performance and cost efficiency across four dimensions: sustained ingest, sub-second filtered queries, high concurrency, and unified access to new and historical events.
What Incident Response Actually Demands
During an incident, the shape of traffic changes dramatically.
Ingestion doesn’t slow down, it often increases. Meanwhile, query patterns become unpredictable: deep JSON predicates, text search filters, high-cardinality group-bys, iterative narrowing of time ranges.
The hardest constraint isn’t raw scan speed. It’s concurrency.
When teams of engineers and SREs run investigative queries simultaneously, systems that look fast in single-query benchmarks begin to degrade. Rebalancing events become visible. Tail latency stretches from sub-second to tens of seconds.
Now add a new variable: AI agents.
Increasingly, incident response isn’t just human-driven. AI agents are being deployed to triage alerts, correlate anomalies, scan related services, and propose root causes. Unlike humans (who investigate serially), agents operate in parallel. A single agent can spawn dozens of queries in seconds. Multiple agents can initiate hundreds of simultaneous filtered scans across time ranges, services, and dimensions.
This fundamentally changes the concurrency model.
Many logging architectures were built on the assumption that only a handful of SREs would actively query the system at once. That assumption no longer holds. When agents and engineers operate together, query fan-out multiplies. What used to be a ~10 QPS system suddenly behaves like a 1000+ QPS investigative workload.
The result is what you might expect: systems optimized for ingestion and basic search reveal their limits at the worst possible time. Tail latency expands. Resource contention becomes visible. Query isolation breaks down.
Teams that operate at scale have already run into this wall.
Why Apache Pinot Changes the Equation
Many logging databases such as Elasticsearch evolved from search-first architectures. They index documents and retrieve matching records efficiently, but large-scale aggregations can stress heap, metadata, and memory layers.
Apache Pinot takes a fundamentally different approach.
Instead of storing each log as a monolithic document, data is stored by column and organized into segments. Performance improvements come from a simple principle: scan less data.
- Only the columns referenced in a query are read
- Columns compress efficiently, especially repetitive log fields
- Segment pruning eliminates entire time ranges before scanning
- Multiple column-level indexes (including inverted, range, and JSON indexes) further reduce data scanned
Even semi-structured JSON fields can be selectively indexed, and unstructured text can be supported via inverted indexes layered on top of columnar storage.
The combined effect is straightforward: less I/O, less memory pressure, less metadata overhead. Queries complete faster not because the system works harder, but because it works on dramatically less data. The result is lower and more predictable latency, along with materially better infrastructure economics.
This is why logs increasingly live on Apache Pinot rather than pure document stores or traditional columnar databases.
Concurrency is where Pinot’s design becomes even more differentiated. Historically, log analytics served a small group of SREs and engineers, so extreme concurrency was not always a primary requirement. Pinot, however, was built from the beginning for real-time, customer-facing analytics with broker/server separation and segment-level parallelism designed to sustain tens of thousands of queries per second at sub-second P99 latency.
That capability increasingly matters. As AI agents, automated remediation systems, and investigative tooling begin operating in swarms, concurrency has become a critical architectural requirement to future-proof log analytics for a world of automated, high-frequency consumers.
Where StarTree Fits
StarTree builds on Apache Pinot and focuses on operational simplicity, enterprise features, and ecosystem integration.
StarTree delivers Apache Pinot as a fully managed cloud service with built-in operational automation, security, scaling, and SLAs.
It also integrates with the broader observability ecosystem — including support for PromQL — allowing teams to unify metrics and log analytics workflows without duplicating infrastructure.
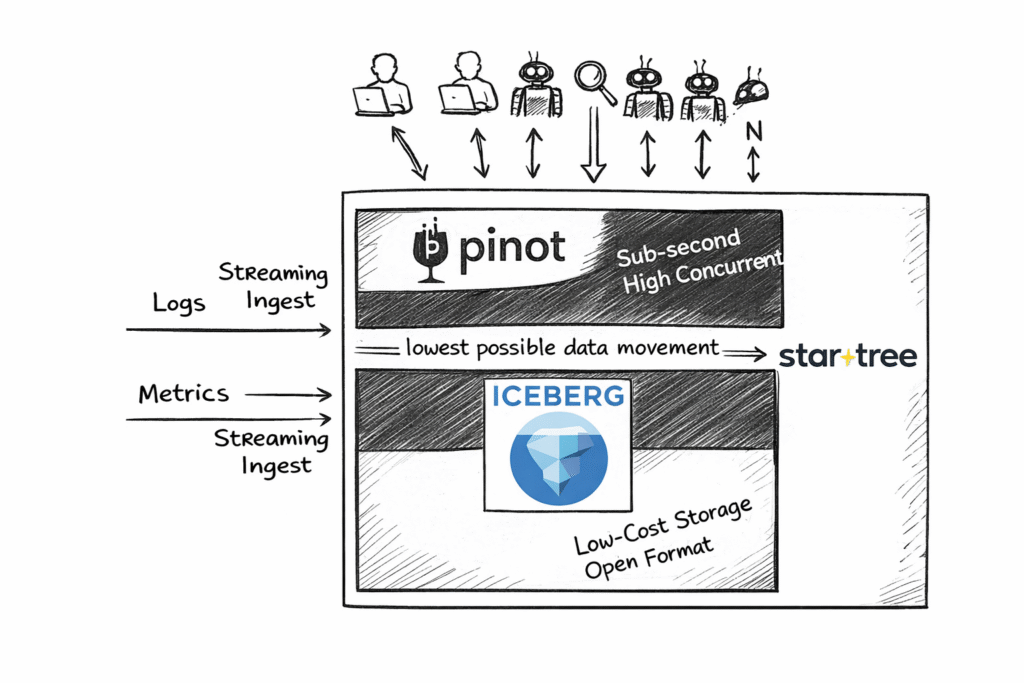
The Innovation: Iceberg Integration for Log Analytics
The most important recent innovation for log analytics is StarTree’s ability to push down queries directly into Apache Iceberg.
Modern data architectures increasingly standardize on open table formats like Iceberg for deep historical storage in object stores. The problem has traditionally been performance: engines built for real-time analytics and engines built for deep storage often required separate systems, redundant pipelines, or costly caching layers.
StarTree changes that.
With Iceberg pushdown:
- Filters and projections execute directly on Iceberg tables
- Only required columns and partitions are read
- Real-time Pinot data seamlessly connects with deep historical data
- No reverse ETL or redundant caching layers are required
This aligns with current architectural trends:
- One open table format
- Multiple interoperable engines
- Minimal data duplication
- Reduced vendor lock-in
For log analytics, this is particularly powerful. Teams can keep massive volumes of historical logs in Apache Iceberg and still achieve sub-second query performance through StarTree’s pushdown execution.
The Pinot layer complements this by providing what Iceberg alone does not: real-time freshness and low-latency ingestion for newly arriving events. Fresh data is immediately queryable in Pinot, while historical data remains in Iceberg, all accessible through a unified query layer.
The result is a single architecture that delivers both sub-second performance on deep history and real-time visibility on fresh logs, without duplicating data, fragmenting systems, or inflating cloud costs.
Simplified Comparison
| Criteria | StarTree (Pinot-based) | Other Columnar Databases |
|---|---|---|
| Sustained Ingest | Real-time streaming ingestion with low-latency segment creation; scales horizontally without metadata blowup. Proven at 50K+ messages/sec. | Often require shard/segment tuning; metadata growth impacts stability. Micro-batching introduces data latency. |
| Filtered Queries | Columnar + inverted indexes; selective JSON indexing; aggressive segment pruning; full predicate and projection pushdown into Iceberg with no performance hit or duplicate storage. | JSON/text + aggregation combos degrade at scale. Iceberg “integration” often duplicates data into proprietary formats or incurs additional cache overhead. |
| High Concurrency | Broker/server separation; segment-level parallelism; predictable tail latency at 1000s–10,000s QPS. | Strong single-query performance; tail latency expands under burst concurrency. |
Uber: Logging as a Real-Time Analytics Problem
At Uber, logs weren’t just archival records — they powered real-time crash analytics, deep I/O observability, and production forensics across a globally distributed system operating at massive scale. As data volumes reached petabytes, architectural limitations in their previous search-oriented stack began to surface: metadata growth slowed cluster operations, late-arriving data required constant reprocessing, and query latency degraded with scale.
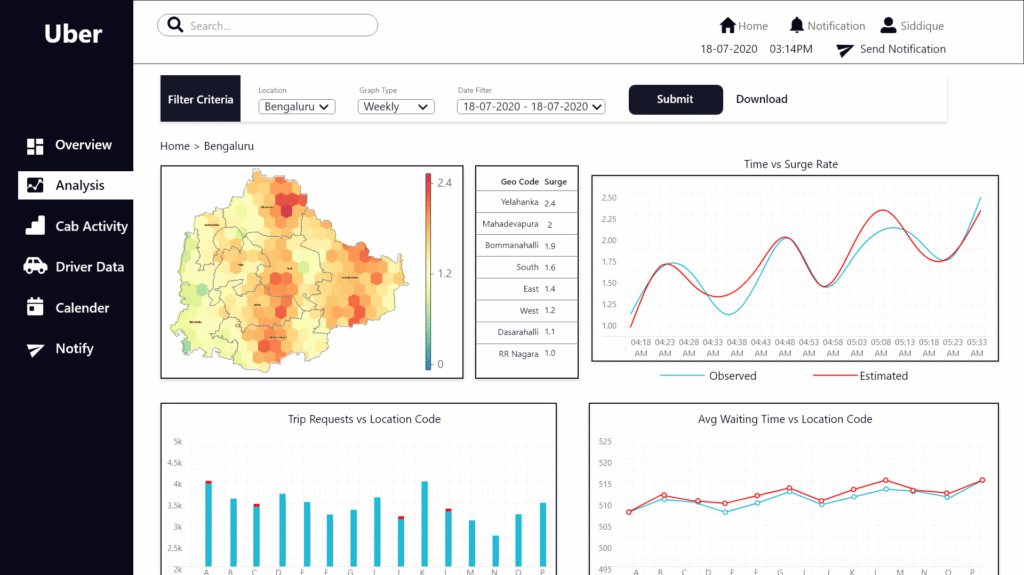
Uber recognized that logs at this scale were analytics workloads, not just storage. They migrated key log-centric analytics (e.g., mobile app crash analysis via their “Healthline” service) from a search-oriented engine to Apache Pinot.
The measurable outcomes were significant:
- ~70 % reduction in infrastructure costs (more than $2 M in annual savings) after moving from Elasticsearch to Pinot for real-time crash analytics.
- ~80 % reduction in CPU cores required to support the analytic workload.
- ~66 % smaller data footprint, reducing storage costs and I/O overhead.
- ~64 % faster page loads for analytic dashboards (from 14 s to under 5 s), improving engineer productivity.
- Sub-10 ms ingestion latency, enabling near-real-time insight.
- Consistent sub-100 ms p99.5 query latencies even at high event rates.
Uber now analyzes logs faster and more economically than their previous infrastructure could support.
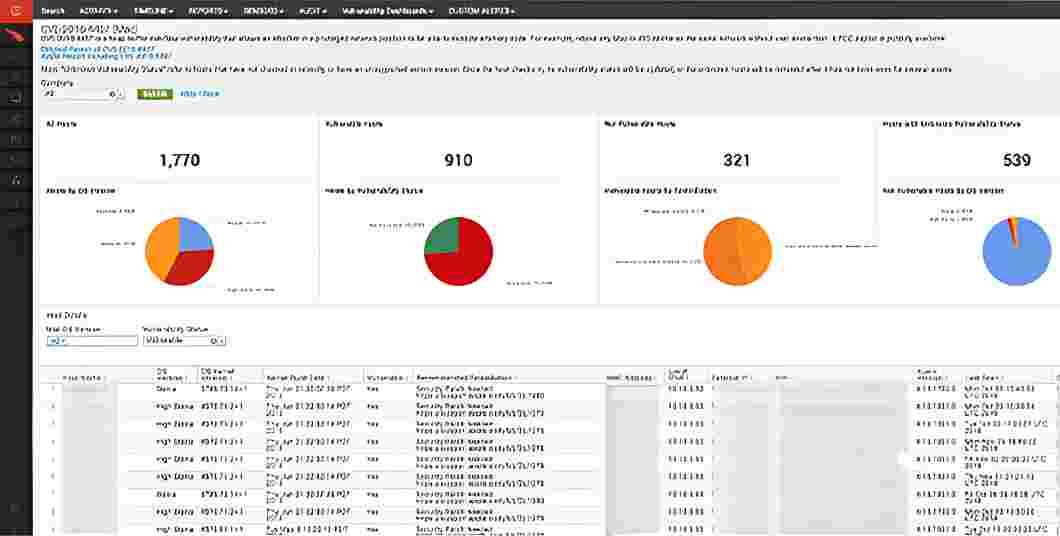
CrowdStrike: High-Concurrency Security Investigation
For CrowdStrike, the constraints were even tighter. Security analysts aren’t running broad dashboard queries — they issue highly selective predicates across enormous volumes of endpoint telemetry. Every investigation can span billions of events, filtered by nested attributes, process lineage, user context, or behavioral signals.
At smaller scales, brute-force scans can work. At CrowdStrike’s scale, they collapse under parallel investigative load.
The core challenges were architectural:
- Maintaining sub-second latency under heavy, simultaneous queries
- Filtering efficiently across deeply nested event structures
- Preserving predictable performance as data volumes and customers grew
Investigations behave like distributed query storms. During active threat response, dozens or hundreds of selective queries can execute in parallel. Systems dependent on wide scans or fragile metadata layers experience tail-latency blowups and resource contention at precisely the wrong moment.
The move to Apache Pinot was about adopting an engine built for that concurrency profile. Segment-level parallelism distributes workload naturally. Inverted indexes accelerate selective predicates. Broker/server separation isolates routing from data scanning.
Cisco Webex: Operating Real-Time Reliability at Massive Scale
At Cisco Webex, observability is mission-critical. With millions of concurrent users across meetings, messaging, and voice, SRE teams must diagnose issues in seconds. As traffic surged during remote work adoption, Webex’s requirements shifted from simple log search to operating the business in real time.
Webex needed to ingest 300,000+ events per second (over 1 billion events per day, ~100 TB daily) with no freshness lag. Dashboards, alerts, and investigations generated hundreds of concurrent queries, and complex aggregations had to return consistently under load.
After adopting Apache Pinot, Webex achieved:
- <1 second ingestion-to-query freshness at peak scale
- 5×–150× lower p99 query latency versus Elasticsearch
- In benchmarks, 67% of Elasticsearch queries failed within a 30s timeout, while Pinot returned results in milliseconds to seconds
- Stable sub-second p99 latency even under high concurrency
- 6.6× data footprint reduction (800 TB → 121 TB raw)
- Elimination of 500+ cluster nodes, significantly lowering infrastructure costs
Pinot enabled unified real-time and historical analytics without duplicate systems, transforming logging from a bottleneck into a real-time operational control plane that directly protects user experience.
Validate incident response before you need it
If you’re evaluating alternatives to Elastic, Druid, or ClickHouse for centralized logging, single-query benchmarks won’t tell the story.
Simulate an incident.
Sustain ingestion for 24 hours. Then introduce 100–200 parallel filtered queries against nested JSON fields. Observe tail latency. Inspect query plans. Introduce late-arriving data. Query across real-time and Iceberg-backed historical partitions.
Measure how the system behaves under pressure, not in isolation. Because incident response is not a steady-state workload. It is bursty, concurrent, and unforgiving.
An application logging cluster designed for that reality behaves very differently from one optimized primarily for dashboards.
Don’t wait to discover the difference when everything is on fire.