In complex distributed systems, stability and reliability aren’t optional—they’re survival skills. Faults and failures aren’t rare events; they’re the norm. Hardware fails, users make mistakes, and software bugs slip through. Sudden traffic shifts can spike CPU, memory, and disk usage while overwhelming internal system resources, adding stress and threatening system stability. Without robust safeguards, these issues can cascade through the system, compromising availability, correctness, and overall integrity.
Apache Pinot is built with these realities in mind. As a distributed system purpose-built for low-latency, real-time analytical queries at scale, Pinot must stay resilient even when components fail or traffic patterns change unexpectedly. Many mission-critical applications depend on Pinot for accurate, low-latency insights—where even brief outages or incorrect results can have significant business impact.
A common example is risk detection. Pinot’s ability to ingest and serve real-time data at scale makes it a go-to engine for powering metrics and alerts. If ingestion slows down or stalls, the resulting data lag can hide critical signals, delaying incident detection and potentially escalating problems across the business.
In this blog, we’ll dive into how Apache Pinot stays resilient under pressure—exploring the strategies that keep the system stable and ensure failures are handled gracefully.
Background
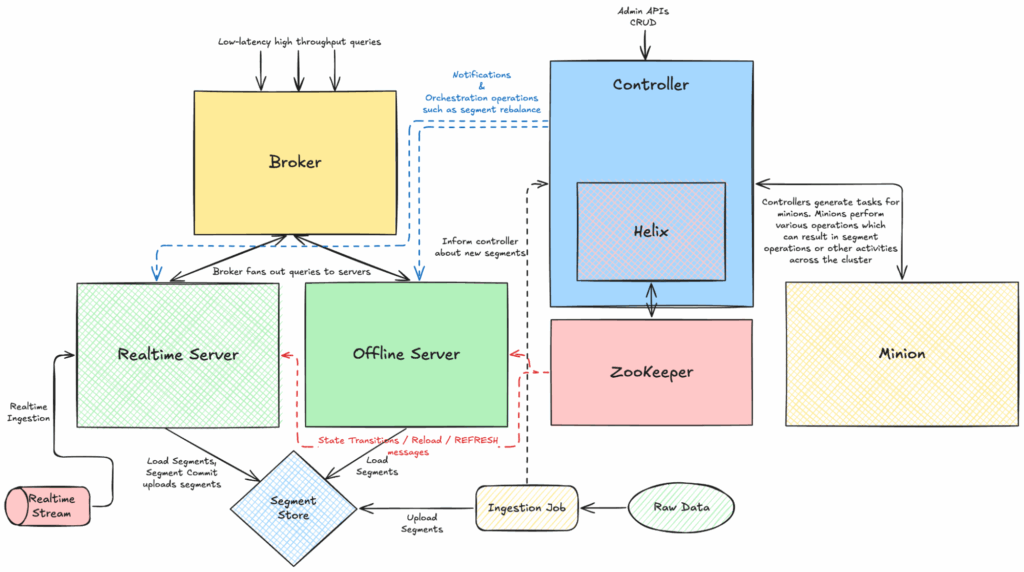
Pinot’s distributed architecture—composed of Controller, Broker, Server, and Minion nodes—must handle low-latency queries, ingest data in real time, and handle cluster-wide operations such as minion tasks, rebalances and reloads, often all at once. This mix of workloads amplifies competition for finite resources, and surges in demand can easily saturate the system, triggering instability or outright failures such as OOMs. Pinot also relies on Apache Helix and ZooKeeper for cluster management and coordination, and at scale can push these systems to their limits, often requiring creative solutions to keep things running smoothly.
Mitigations such as scheduling resource heavy operations during off-peak hours or over-provisioning resources can provide temporary relief, but they are often impractical in a 24/7 system and become prohibitively expensive at scale. The smarter approach is to design for resilience: use automation, guardrails, and intelligent resource management so Pinot can handle spikes gracefully without sacrificing stability or breaking the budget.
Some of Pinot’s strategies to be more reliant are as follows:
- Rate limiting / throttling resource intensive operations
- Early detection and prevention of issues
- Graceful error handling
Taming the traffic with throttling
We introduced throttling in Pinot across various components, intentionally slowing down the most resource-intensive operations where possible to protect critical query performance and maintain system stability.
Segment Operations Throttling
While day-to-day ingestion scaled smoothly as customers pushed more and more into Pinot and query volumes climbed, we started noticing stress on servers during unusual bursts—like when a large backfill ran, or a server recovered after a crash. In those moments, segment operations could drive up CPU and disk usage, leading to slower queries until the system stabilized.
Segments in Pinot come from multiple sources — offline ingestion, real-time streams, or Minion tasks that rewrite or update data. Each new segment shows up in a table’s IdealState ZNode, and the Helix rebalancer (running on a Controller) sends state transition messages to servers telling them to bring the new segment online.
That’s when the servers get to work. For every segment, they may need to perform the steps outlined below:
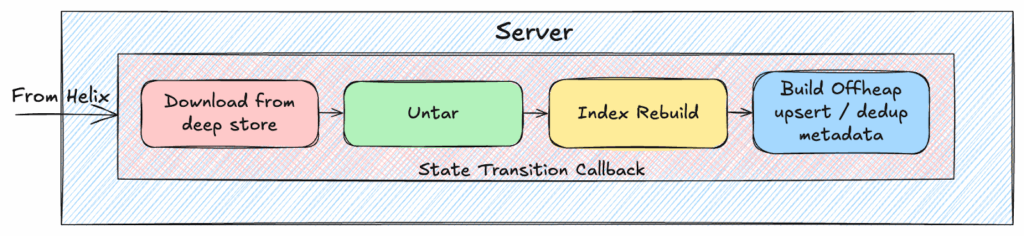
When segments are replaced or reloaded, the same process kicks off, performing a subset of the work. These steps can be expensive, sometimes taking minutes, and they compete directly with query execution for finite resources. During peak load, this meant user-facing queries slowed down or spiked in latency — the exact opposite of what Pinot is built for.
Initially, we tried simply tuning the number of Helix’s message-processing threads. But changing that configuration required disruptive restarts, was too conservative, and didn’t even cover all operations such as segment reload and refresh operations. We needed something safer and more adaptive.
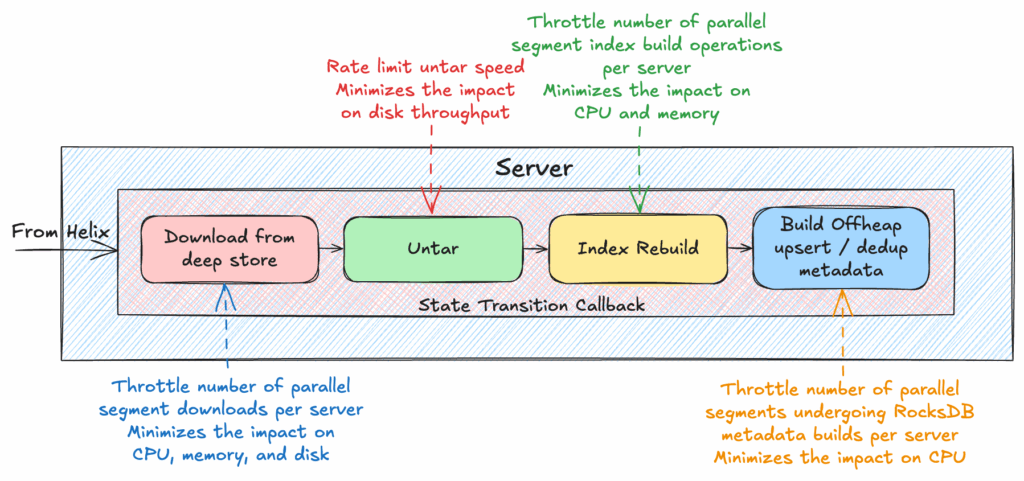
So we built a segment operations throttling framework to control the parallelism of segments undergoing each operation:
- Dynamic config updates framework — no restarts required to change the parallelism limits, foundational framework usable by other configurations in Pinot
- Per-operation limits — download, index rebuild, and upsert / dedup handling each get their own parallelism thresholds with flexibility to configure different thresholds for before and after the server is ready to serve queries.
- Granular controls for expensive operations — like tuning StarTree index rebuilds separately.
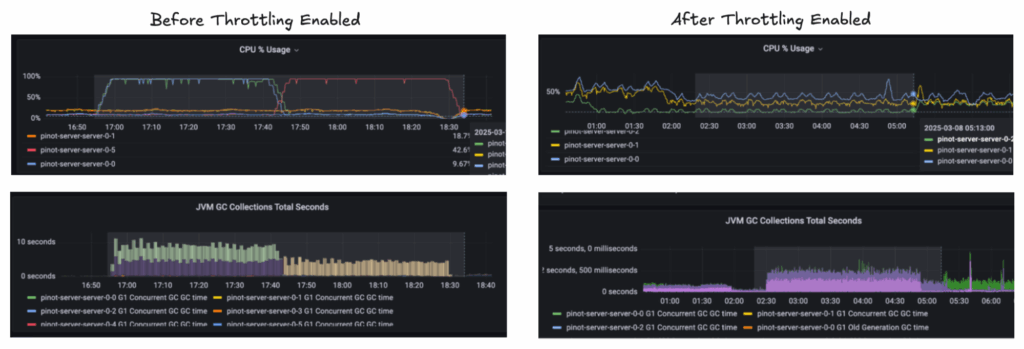
The impact was immediate. CPU spikes flattened out, tail latencies became predictable again, and incidents caused by overloaded servers dropped dramatically. Pinot could now scale more confidently without sacrificing query performance or system stability. More information can be found in our OSS docs.
Without throttling segment level operations, we see high CPU utilization, at almost 100%, and more GC pressure in the 10s of seconds when a large number of segments are added. With throttling enabled, the CPU drops to below 50% utilization and GC also drops to under 1 second while performing the same operation. A comparison can be found below:
Rebalance Batching
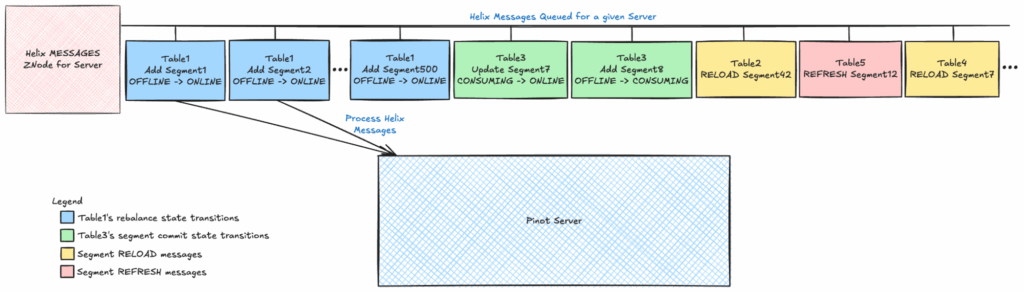
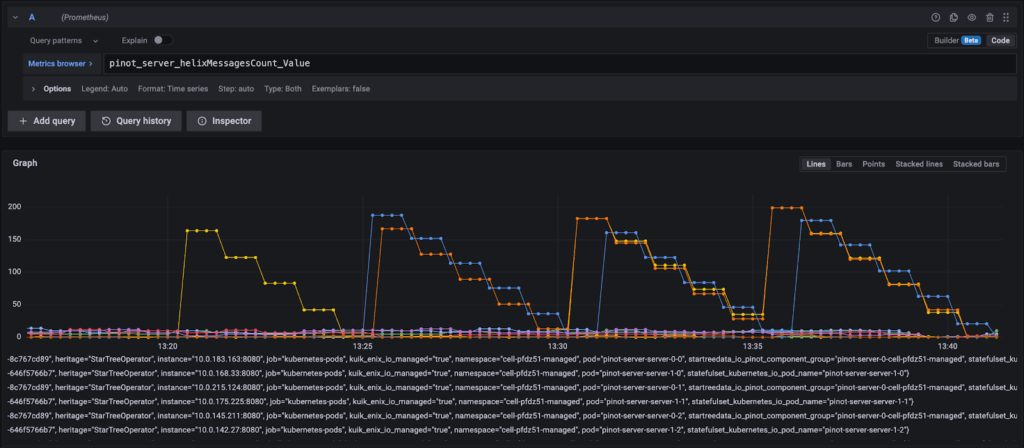
As some customers pushed the limits of Pinot with 10K–100K+ segments per table, we started running into scale issues during rebalance operations. When a rebalance added hundreds or thousands of segments per server via IdealState updates, we noticed a surprising side effect: other tables’ ingestion would get stalled. The controllers would continue committing segments as expected, but the state transitions for those commits weren’t processed by the servers for hours. This meant segments weren’t moving into CONSUMING state fast enough, causing ingestion lag and triggering alerts. We saw similar effects for other types of state transitions such as segment deletion as well.
The root cause turned out to be the Helix message queue. Each server has a single queue that handles all operations—segment commits, user-defined messages such as reloads, and other state transitions. When a rebalance floods this queue with hundreds to thousands of state transition messages, unrelated updates (like those for new real-time segments) end up waiting in line, delaying ingestion for hours.
To fix this, we introduced batchSizePerServer — a parameter that limits how many rebalance-related state transition messages are sent to each server at once. This keeps the Helix queue responsive for other operations while still making steady progress on the rebalance. The result: rebalances complete smoothly without starving ingestion, and clusters remain stable and predictable even at large scale.
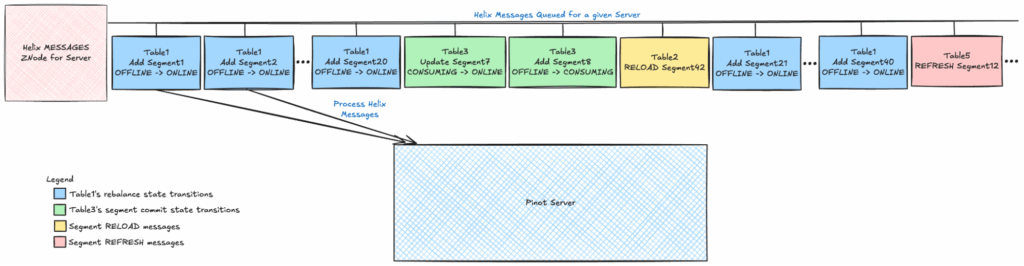
batchSizePerServer=20, only 20 segments are queued at once for rebalance, allowing other operations—like segment commits—to interleave their state transitions. This helps the system respond faster to those operationsRebalance run without setting a batchSizePerServer results in hitting the maximum queue size of 1000, and draining the queue takes longer:
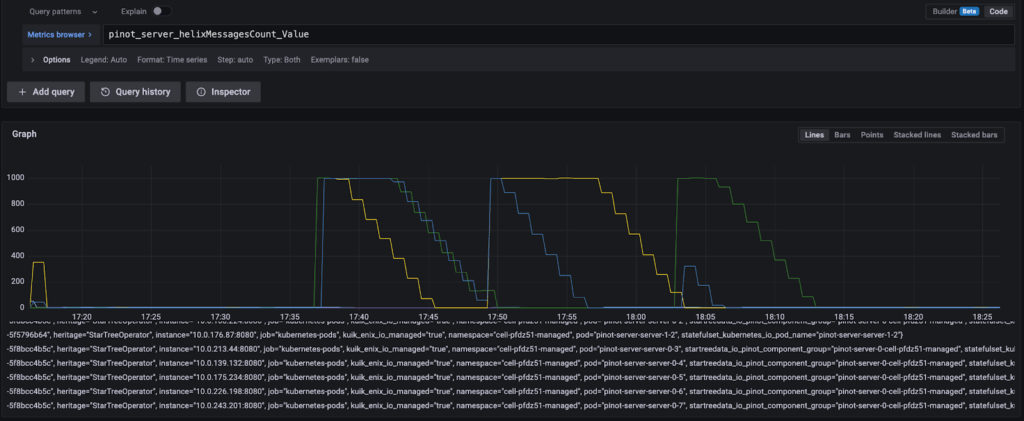
Rebalance run with batchSizePerServer enabled. The Helix queue never has more entries than the batch size of 200 and is drained much faster:
batchSizePerServer=200, the Helix messages queue size doesn’t increase beyond 200 and drains fasterOther Throttles
We also added guardrails for real-time ingestion and queries themselves which are also resource intensive operations:
- Ingestion throttling to prevent sudden ingestion rate surges from overwhelming servers.
- Parallel segment build limits to cap expensive real-time segment builds.
- Query throttling + killing for runaway queries that risk OOMs.
- Multi-stage query throttling tied to thread utilization.
Together, these throttles keep Pinot’s workload balanced and predictable, even under volatile traffic. Stay tuned for future blog posts diving deeper into these topics.
Prevention is better than the cure
The best way to keep a system stable is to stop issues before they snowball. In Pinot, that means watching for early signals—like rising disk usage or growing data structures—and acting before they tip servers and other components into failure. Metrics and alerts help, but some operations can drain resources so quickly that guardrails need to go beyond simple monitoring. Here’s how we’ve approached some of these challenges in Pinot.
Pausing Ingestion
We would sometimes find that a cluster would be humming along smoothly when suddenly one (or a few) server’s disk usage would shoot up. Sometimes it was a surge in real-time ingestion, other times it was a wave of offline segments being pushed in, or even a heavy operation like a rebalance running. Within minutes to a few hours, that server’s disk would be full, segments would drop into error state, and the table would become unavailable.
The tricky part? These spikes often happened faster than we—or our customers—could react. Adding disk capacity wasn’t always an option either; it required coordination, came with cost implications, and didn’t solve the fact that the problem was unpredictable.
Upsert tables brought another wrinkle. When too many primary keys landed on a single server, not only did the RocksDB (used to store the primary keys) performance degrade due to a higher chance of cache misses on get() operations, but server restarts and table rebalances also became a nightmare. While upsert snapshots can be used to speed up server restarts and table rebalances, it alone is not sufficient as metadata updates must still be performed. This causes server start-up time to increase and leads to longer server unavailability. To add to this, snapshots can’t always be used, resulting in even longer time to process the upsert primary keys and metadata per segment. Stabilizing the system often required tedious manual intervention. The only sustainable solution was to scale out, spreading the primary keys across more servers.
We knew we needed a way to get ahead of the problem—to detect resource pressure early and take action before servers tipped over.
To tackle this, we built a set of guardrails into Pinot:
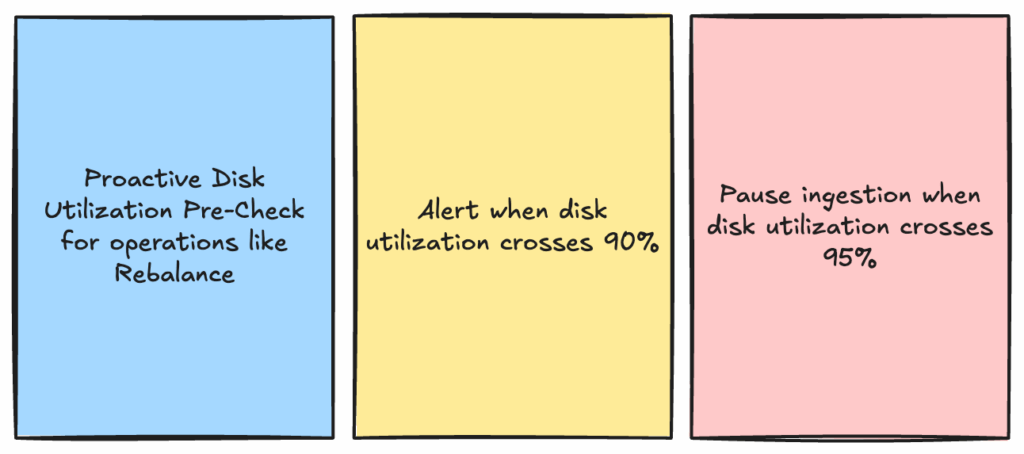
Figure 9: Guardrails for disk utilization
- Automated monitoring and ingestion pause: We added a mechanism to pause ingestion if either disk utilization crosses 95% or if the number of primary keys hosted by a server crosses 3 billion. A controller periodic task tracks the resource utilization across all the servers of a given table. If any server hosting the table crosses the threshold, Pinot automatically pauses real-time ingestion and blocks minion tasks until utilization drops. This protects availability by preventing servers from filling up completely or exhausting primary key usage. (Yes, pausing ingestion can risk data loss if upstream retention is short, but exhausting disk is far worse—causing both data loss and downtime.) This can be extended in the future to support other resource utilization checks as well.
- Early warning alerts: Thresholds are set lower than the pause triggers, giving operators a buffer to act before automated measures kick in.
- Proactive pre-checks: Before expensive operations like rebalances, Pinot runs pre-checks to ensure disk usage won’t exceed safe limits once the data is redistributed and provides warnings to the user. The user can act on this by proactively adding disk capacity prior to running the rebalance.
Since introducing these safeguards, we’ve seen a steep drop in incidents caused by resource exhaustion. Servers stay healthier, operators spend less time firefighting, and clusters can withstand sudden spikes without tipping into instability. We plan to extend some of these principles to other types of resources within Pinot as well.
Helix and ZooKeeper Fine Tuning
Helix and ZooKeeper sit at the heart of Pinot. They orchestrate everything from cluster management to making new segments queryable. When either of these systems runs into trouble, the entire cluster can grind to a halt.
Here’s how it works: Helix uses ZooKeeper to coordinate cluster actions by writing messages and state transitions into ZNodes. For example, when a new segment is created, the Controller decides which servers should host it and updates the IdealState with this information. Then the Helix rebalancer runs and writes state transition messages into the messages queue ZNode of the corresponding servers so those servers know that they need to download and serve the segment.
At scale, this process can create headaches. Thousands of state transitions can flood a server’s Helix message queue, causing long delays in processing. Meanwhile, ZooKeeper stores metadata like a table’s IdealState and ExternalView in ZNodes that were never designed to hold huge payloads. As the number of segments grows, these ZNodes can bloat beyond safe limits, leading to read errors. While increasing the ZNode limit may be an option, it is usually not recommended as it affects ZooKeeper performance and stability. On top of that, bursts of state transitions drive spikes in ZooKeeper’s disk utilization—sometimes exhausting capacity and temporarily destabilizing the cluster.
To get ahead of these issues, we made several improvements:
- Compressed ZNodes: We enabled automatic ZNode compression to shrink its size. We also reduced the threshold for when compression kicks in to minimize the ZNode size stored on ZooKeeper disk. This helps today, though as segment counts grow we expect to start hitting the ZNode size limit even with compression enabled. To address this we’re exploring longer-term solutions such as logical tables.
- Capped state transitions: By reducing the maximum concurrent state transitions per instance, we keep Helix queues manageable and avoid overwhelming ZooKeeper disk. We also proactively increased ZooKeeper disk capacity across deployments to absorb temporary spikes.
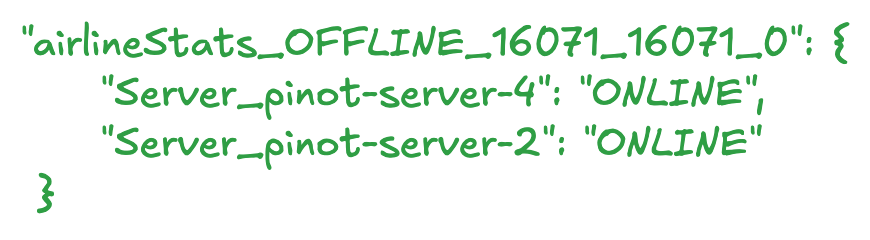
- Optimized state transitions: For segment deletions, we cut down unnecessary hops. Instead of requiring two transitions (e.g., ONLINE → OFFLINE → DROPPED), we now go directly from ONLINE → DROPPED). This change alone significantly reduced the volume of transition messages during large deletions.
Since implementing these changes, we’ve seen far fewer issues with ZooKeeper disk exhaustion and ZNode sizes getting too large and have achieved overall stronger cluster stability.
Handle Errors Gracefully
No system can assume perfect data or flawless user inputs. Mistakes happen—whether it’s misconfigured table configs, schema mismatches, or evolving features that introduce compatibility issues. Left unchecked, these errors can erode trust and make the system harder to use.
We started by identifying the most common areas where users ran into configuration or data issues, and looked for places where stronger guardrails or validations could help. Even with detailed documentation warning about incompatible configs, it was still easy for users to create tables that looked fine—until ingestion failed later. As Pinot evolved, so did the way indexes were configured. While we’ve worked hard to keep older setups backward compatible, that added complexity sometimes led to missed edge cases or unexpected behavior. In some cases, ingestion could stall because of bad data or a broken transform function—problems that aren’t always simple to fix upstream. To make the system more resilient, we focused on catching issues earlier and handling them more gracefully. Some examples include:
- Stronger table config and schema validations to prevent unsupported setups (e.g., using JSON or BIG_DECIMAL types for multi-value columns, or defining a multi-value upsert primary key).
- Consolidated index config checks across old and new TableConfig versions to reduce conflicts and prevent unexpected behavior.
- Skip-bad-records support for certain indexes, improving ingestion and segment build reliability instead of failing outright.
These steps reduce surprises and improve resilience, but there’s more to do—such as simplifying ingestion transforms or skipping building certain indexes due to misconfiguration to further cut down on errors.
Conclusion
Building a distributed system like Pinot isn’t just about speed and scale—it’s about resilience. As we’ve shown, guardrails like throttling, preventing issues from escalating, and early error detection are what keep Pinot stable under pressure. They ensure that even when hardware fails, workloads spike, or users make mistakes, the system continues to deliver low-latency, reliable results.
Future Work
Of course, stability isn’t a one-time project. Every new feature, use case, and scale milestone brings fresh challenges. The work of adding guardrails, refining strategies, and learning from real-world incidents never stops. But each improvement makes Pinot stronger—and gives our users the confidence to trust it for their most critical workloads.
We have several enhancements planned in this area. Upcoming work includes better handling of bad data and misconfigurations—like invalid transform functions or invalid index configurations—as well as smarter throttling for expensive operations to keep the system stable and responsive. We have also planned further improvements in Helix message queue management for operations other than rebalance that can also overwhelm the queue.
Configuring Pinot can be tricky, especially with all the nuances in the TableConfig and schema setup. As use cases grow, teams often need to evolve these configs—adding new indexes, changing fields, or tweaking ingestion settings. However, understanding the impact of those changes isn’t always straightforward. To add to the complexity, not all issues can be caught while creating or updating the config. To make this process easier, StarTree Pinot will be introducing the Table Preview API. This new API helps users validate their configuration changes and see how they’ll affect their tables before deploying them. By catching issues early and providing instant feedback, it makes iteration faster, safer, and far less stressful—so users can experiment confidently without breaking production. This topic deserves its own discussion, so stay tuned to learn more in a future blog.
Connect With Us
Millions of concurrent users. Petabytes of data. Tens of thousands of queries per second. Hundreds of thousands of events flowing every second. If these are the kinds of numbers you operate with, aspire to handle, or are simply curious about, let’s connect! We’d love to share our lessons in serving at scale, hear your use cases, and geek out over low-latency analytics.
- Join the community slack Apache Pinot, StarTree Community
- Follow our adventures on LinkedIn StarTree
- Catch us on X Apache Pinot, StarTree