
Grafana has become the de facto standard for visualizing operational metrics, thanks to its rich ecosystem and intuitive PromQL-based query experience. While a variety of time-series databases can power these dashboards, many teams eventually run into a common challenge: high-cardinality metrics. As dimensionality and label combinations grow, traditional time-series backends often struggle with exploding series counts, rising infrastructure costs, and increasing operational complexity. To address this, many organizations have been adopting StarTree Cloud as a scalable backend purpose-built for high-cardinality, multi-dimensional time-series workloads. Now, we’re making that integration even easier.
The StarTree Pinot datasource for Grafana is now available in the Grafana marketplace. In early access deployments, customers moving high-cardinality observability workloads to StarTree have seen 50% reduction in storage costs, a 4x improvement in query performance, and sub-second Grafana dashboard latency for common dashboard queries — while sticking with familiar PromQL and Grafana workflows.
This post walks through how to get Prometheus-style metrics into Pinot, connect Grafana, build a useful first dashboard, tune query performance, and debug the most common issues.
Why this matters for Grafana users
Platforms are generating more metrics than ever. Kubernetes, microservices, ephemeral pods, autoscaling, and increasingly detailed service-level instrumentation all multiply the number of unique label combinations in a metrics system.
That creates three familiar problems:
- Metrics explosion. Every unique combination of label values creates a separate time series. A single counter such as http_requests_total across service, pod, region, and status can fan out into millions of active series, many of which are sparse or short-lived.
- Slow dashboards. High-cardinality filters, regex matchers, wide time ranges, and top-N queries can push traditional time-series systems into slow scans and unpredictable p95 or p99 latency.
- Expensive retention. Metrics are valuable long after the incident is over, but many systems make long retention expensive because they keep too much historical data on hot storage.
StarTree, powered by Apache Pinot, provides a more robust path with real-time ingestion, columnar storage, native PromQL execution, and tiered storage for older data. For observability workloads, the ability to extend retention with tiered storage becomes particularly valuable when engineers often need the ability to go back further when investigating regressions or long-running trends.
With the StarTree Pinot datasource for Grafana, your dashboards can keep speaking PromQL while Pinot handles the scale underneath.
What you can build
With the StarTree Pinot datasource for Grafana, you can build PromQL dashboards over real-time metrics stored in StarTree or Apache Pinot.
A typical dashboard might include:
- Request rate by service
- Error rate by service or status code
- Top pods by request volume
- Regional traffic breakdowns
- High-cardinality drilldowns across labels such as namespace, pod, cluster, or region
- Longer-retention views that stay queryable without keeping every segment on hot local SSD
The key idea is simple: Grafana remains the dashboarding experience, PromQL remains the query language, and Pinot becomes the scalable real-time metrics engine behind it.
Architecture at a glance
The end-to-end flow looks like this:
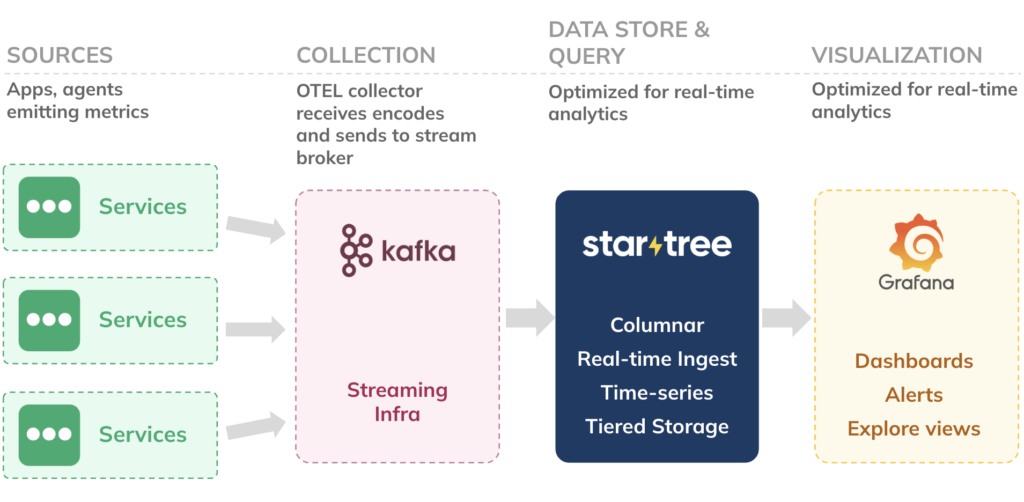
Your services emit metrics. An OpenTelemetry Collector or equivalent pipeline normalizes and publishes them to Kafka in Prometheus text exposition format. StarTree consumes that Kafka topic using PrometheusMessageDecoder, stores the samples in Pinot columnar segments, and serves PromQL through Pinot’s Time Series Engine. The Grafana datasource plugin sends PromQL requests to the StarTree broker and renders the results in Grafana panels.
The important contract is simple: by the time metrics reach Pinot, each sample becomes a row with four fields: metric, labels, value, and ts.
Prerequisites
Before you start, you’ll need:
- A StarTree Cloud cluster with the Time Series Engine enabled
- A Kafka topic containing Prometheus text exposition metrics
- A Pinot realtime table configured with
PrometheusMessageDecoder - Grafana with permission to install data source plugins
- A StarTree API token
- The broker URL for your StarTree cluster
This walkthrough uses the following example names:
| Item | Example value |
|---|---|
| Kafka topic | otel-metrics-prom |
| Pinot schema | prometheusMsg |
| Pinot logical table | prometheusMsg |
| Example metric | http_requests_total |
| Example labels | service, method, status, pod, region |
Replace these names with the topic, table, metric, and label names from your own environment.
Metrics data model
A Prometheus text line on the Kafka topic might look like this:
http_requests_total{method="GET",status="200",service="checkout"} 1847.0 1741011820123Code language: JavaScript (javascript)Pinot maps that into one row:
| Field | Value |
|---|---|
metric | http_requests_total |
labels | { "method": "GET", "status": "200", "service": "checkout" } |
value | 1847.0 |
ts | 1741011820123 |
Prometheus-style realtime tables use these field names and types. See the StarTree PromQL Documenation to understand the schema needed in the Pinot table:
| Field | Type | Role |
|---|---|---|
metric | STRING | Prometheus metric name |
labels | JSON | Label key-value pairs |
value | DOUBLE | Sample value |
ts | TIMESTAMP | Event time in milliseconds since Unix epoch |
The field names must match exactly. The labels field must contain valid JSON. If your upstream column names differ, use transform functions in Pinot so the table still exposes metric, labels, value, and ts to the Time Series Engine.
Ingest metrics from Kafka into Pinot
To make the example concrete, imagine a Kafka topic named otel-metrics-prom carrying the UTF-8 Prometheus exposition lines shown in the example above. We will create a Pinot schema called prometheusMsg, then a realtime Pinot table that consumes the topic with PrometheusMessageDecoder.
Schema
{
  "schemaName": "prometheusMsg",
  "dimensionFieldSpecs": [
    { "name": "metric", "dataType": "STRING" },
    { "name": "labels", "dataType": "JSON" }
  ],
  "metricFieldSpecs": [
    { "name": "value", "dataType": "DOUBLE" }
  ],
  "dateTimeFieldSpecs": [
    {
      "name": "ts",
      "dataType": "TIMESTAMP",
      "format": "1:MILLISECONDS:EPOCH",
      "granularity": "1:MILLISECONDS"
    }
  ]
}
Code language: JSON / JSON with Comments (json)
Realtime table config
This table config wires Kafka to Pinot for Prometheus text metrics. Replace YOUR_METRICS_TOPIC and YOUR_KAFKA_BOOTSTRAP with your own values.
{
  "tableName": "prometheusMsg",
  "tableType": "REALTIME",
  "segmentsConfig": {
    "timeColumnName": "ts",
    "schemaName": "prometheusMsg",
    "replicasPerPartition": "1"
  },
  "tenants": {},
  "tableIndexConfig": {
    "loadMode": "MMAP",
    "invertedIndexColumns": ["metric"],
    "jsonIndexConfigs": {
      "labels": {
        "maxLevels": 2,
        "excludeArray": false,
        "disableCrossArrayUnnest": true,
        "includePaths": ["service", "pod", "region", "status"]
      }
    },
    "streamConfigs": {
      "streamType": "kafka",
      "stream.kafka.consumer.type": "lowlevel",
      "stream.kafka.topic.name": "YOUR_METRICS_TOPIC",
      "stream.kafka.decoder.class.name": "ai.startree.pinot.plugin.inputformat.prometheus.PrometheusMessageDecoder",
      "stream.kafka.consumer.factory.class.name": "org.apache.pinot.plugin.stream.kafka30.KafkaConsumerFactory",
      "stream.kafka.broker.list": "YOUR_KAFKA_BOOTSTRAP:9092",
      "realtime.segment.flush.threshold.rows": "0",
      "realtime.segment.flush.threshold.time": "24h",
      "realtime.segment.flush.threshold.segment.size": "50M",
      "stream.kafka.consumer.prop.auto.offset.reset": "smallest"
    }
  }
}
Code language: JSON / JSON with Comments (json)
Two details are worth calling out:
First, metric has an inverted index. Dashboard queries usually start by narrowing to a metric name, so this is a high-value filter.
Second, the labels JSON index includes common dashboard filter paths such as service, pod, region, and status. You should tune this list to match the labels your users commonly filter on in Grafana.
Configure the Grafana data source
Once the Pinot table is ingesting metrics, configure Grafana to query it.
- Install the StarTree Pinot plugin for Grafana from the Grafana plugin catalog.
- In Grafana, go to Connections → Data sources → Add data source.
- Search for StarTree and select the StarTree Pinot datasource.
- Set the host URL to your StarTree broker endpoint, for example
https://broker.your-cluster.startree.cloud/ - Paste your StarTree API token into the token field. The token stays on the Grafana server.
- Click Save & test.
After the data source is saved, create a panel, choose the StarTree data source, switch to PromQL mode, and select your physical realtime table, such as prometheusMsg_REALTIME.
Note: The Grafana plugin allows querying datasets in any Pinot cluster. However, for building panels using PromQL dialect, you will need a StarTree environment.
Build your first dashboard
Start with one simple panel before you build a full dashboard.
Your first panel
- Create a new Time series panel.
- Select the StarTree data source.
- Switch the query editor to PromQL.
- Select
prometheusMsg_REALTIME. - Set the dashboard time range to Last 1 hour.
- Run:
rate(http_requests_total{service="checkout"}[5m])Code language: JavaScript (javascript)You should see one or more time series for the checkout service. If the panel is empty, first run the bare metric to confirm data exists:
http_requests_totalIf the bare metric returns data, add label filters back one at a time. This helps separate ingestion issues from label-name or label-value mismatches.
Four useful starter panels
A practical first dashboard usually needs more than one panel. Try these four.
1. Request rate by service
sum(rate(http_requests_total[5m])) by (service)Code language: CSS (css)Use this to see whether traffic is distributed as expected across services.
2. Error rate by service
sum(rate(http_requests_total{status=~"5.."}[5m])) by (service)
/
sum(rate(http_requests_total[5m])) by (service)Code language: JavaScript (javascript)
Use this as a top-level service health panel. If your status labels use different names or values, update the matcher accordingly.
3. Top five pods by request volume
topk(5, sum(rate(http_requests_total[5m])) by (pod))Code language: CSS (css)This is useful when you need to spot hot pods or uneven traffic distribution.
4. Requests by status code
sum(rate(http_requests_total[5m])) by (status)Code language: CSS (css)Use this to understand the mix of successful, redirected, client-error, and server-error responses.
Use Grafana variables for reusable dashboards
Dashboard variables let you reuse the same dashboard across services, regions, namespaces, or clusters.
Common variables include:
$service$region$namespace$cluster$status
For example:
sum(rate(http_requests_total{service="$service", region="$region"}[5m])) by (status)Code language: JavaScript (javascript)Variables work best when they map to label paths you have indexed in Pinot. Avoid regex-heavy multi-select variables over very high-cardinality labels such as pod, container_id, or instance unless you have tested the dashboard under realistic load.
Make dashboard queries fast
Grafana dashboard performance is a joint contract between the metric shape, the Pinot table config, and the PromQL query.
Index the labels people filter on
PromQL label matchers filter inside the JSON labels column. A JSON index on labels speeds equality-style predicates on paths you declare up front.
Good default label paths for dashboard workloads often include:
- service
- region
- namespace
- cluster
- status
- method
- pod, with some caution because pod labels can be high-cardinality and short-lived
The right list depends on how you filter dashboards. Index the labels that appear in dashboard variables, repeated panels, alerts, and common incident queries.
Prefer equality matchers where possible
This is a good dashboard query shape:
rate(http_requests_total{service="checkout", region="us-east"}[5m])Code language: JavaScript (javascript)The metric name is explicit, and the label matchers are equality filters over likely indexed paths.
Regex matchers are useful, but they can force broader scans:
<code>rate(http_requests_total{pod=~"checkout-.*"}[5m])</code>Code language: HTML, XML (xml)Use regex matchers deliberately, especially on high-cardinality labels.
Be careful with wide windows and tiny steps.
A very wide time range with a very small step can produce a large number of points and heavy merge work. For interactive dashboards, tune Grafana’s time range and minimum step so the query returns enough detail for the panel without overwhelming the backend.
Aggregate before showing high-cardinality labels
This query can produce a large number of output series:
sum(rate(http_requests_total[5m])) by (pod)Code language: CSS (css)That may be useful for debugging, but it is often too noisy for a top-level dashboard. Prefer top-N views for high-cardinality labels:
topk(5, sum(rate(http_requests_total[5m])) by (pod))Code language: CSS (css)Troubleshooting
When a dashboard does not behave as expected, start with the simplest possible query and add complexity gradually.
| Problem | Likely cause | What to check |
|---|---|---|
| Grafana panel is empty | Wrong table, time range, metric name, or label filter | Query the bare metric first, confirm the table is *_REALTIME, and widen the time range |
| Bare metric returns data, but filtered query does not | Label key or value mismatch | Inspect the labels JSON in Pinot and add filters back one at a time |
| rate(…[5m]) shows no data | Not enough samples in the selected time range | Widen the dashboard time range or use a longer range vector |
| Query is slow | Regex matcher, wide time range, high-cardinality grouping, or missing JSON index | Prefer equality filters, reduce the time range, use topk, and index common label paths |
| Save & test fails | Broker URL, token, or network issue | Confirm the broker endpoint, API token, token scope, and network access from the Grafana server |
| Dashboard variable is slow | Variable query scans a high-cardinality label | Use lower-cardinality labels for variables or confirm the label path is indexed |
| Autocomplete or label suggestions are missing | Metadata cannot find the expected table or label paths | Confirm the selected table, table name, and indexed label paths |
How it works under the hood
For the metrics workloads like these, StarTree does not treat PromQL as generic SQL with a compatibility layer on top. Pinot’s Time Series Engine parses PromQL, builds a plan, fans work out to servers, scans columnar segments with the indexes you configured, and merges partial series at the broker.
A query such as this:
sum(rate(http_requests_total{service="payment"}[5m]))Code language: JavaScript (javascript)roughly follows this path:
- Grafana sends the PromQL request through the StarTree Pinot datasource.
- The datasource backend calls StarTree’s broker time series API.
- Pinot’s Time Series Engine parses and plans the PromQL expression.
- The broker routes work to servers that host relevant segments for the selected table and time range.
- Servers scan only the columns and row groups needed for the query, using configured indexes where possible.
- Servers compute partial series.
- The broker merges the partial results and returns the response to Grafana.
This execution model matters most at high cardinality. Pinot’s immutable segments, columnar layout, routing metadata, and indexes help prune work before the system scans unnecessary data. That is why query shape and table design both matter: Pinot gives you room to scale, and good dashboard design helps the engine avoid wasted work.
Why tiered storage matters for metrics
Metrics retention is usually a trade-off. Recent data needs to be fast because it powers active dashboards, alerts, and incident response. Older data is still valuable for historical analysis, capacity planning, and postmortems, but keeping all of it on hot storage can be expensive.
StarTree tiered storage allows you to keep recent segments on local SSD while moving older segments to S3 or GCS, where they remain queryable. That gives you a way to extend retention without treating every byte of historical metrics as equally hot.
For observability workloads, this is especially important because the highest-volume data is not always the most frequently queried. Most dashboards look at recent windows, but engineers still need the ability to go back further when investigating regressions or long-running trends.
What’s next
The StarTree Pinot datasource for Grafana is available now. If you already use StarTree Cloud and Grafana, you can start by installing the plugin, pointing it at your StarTree broker, and creating one PromQL panel over a realtime metrics table.
A good first path is:
- Ingest Prometheus text metrics into Kafka.
- Create a Pinot schema with
metric,labels,value, andts. - Configure a realtime table with PrometheusMessageDecoder.
- Install the StarTree Pinot datasource for Grafana.
- Build a first dashboard with request rate, error rate, top pods, and status-code breakdowns.
- Add JSON indexes for the labels your users actually filter on.
- Test dashboard latency using realistic time ranges, variables, and concurrency.
High cardinality data should not force you to choose between useful dashboards, long retention, and predictable cost. With StarTree, Apache Pinot, Grafana, and PromQL, you can keep the dashboarding workflow your users already know while moving the metrics backend to an engine built for real-time analytics at scale.
Try StarTree Today
If you’re not yet a StarTree customer, you can try out the steps in this guide with a free StarTree Trial.